Booz Allen Hamilton Holding Corporation's management explains the business in its own materials. The slides below do the most of that work, pulled from the documents preserved in Sources. Each source link opens the complete presentation at that slide in a new tab.
The most recent full-year deck: FY2026 results, capital deployment, and the initial FY2027 guidance management now works to. · Open the full document →
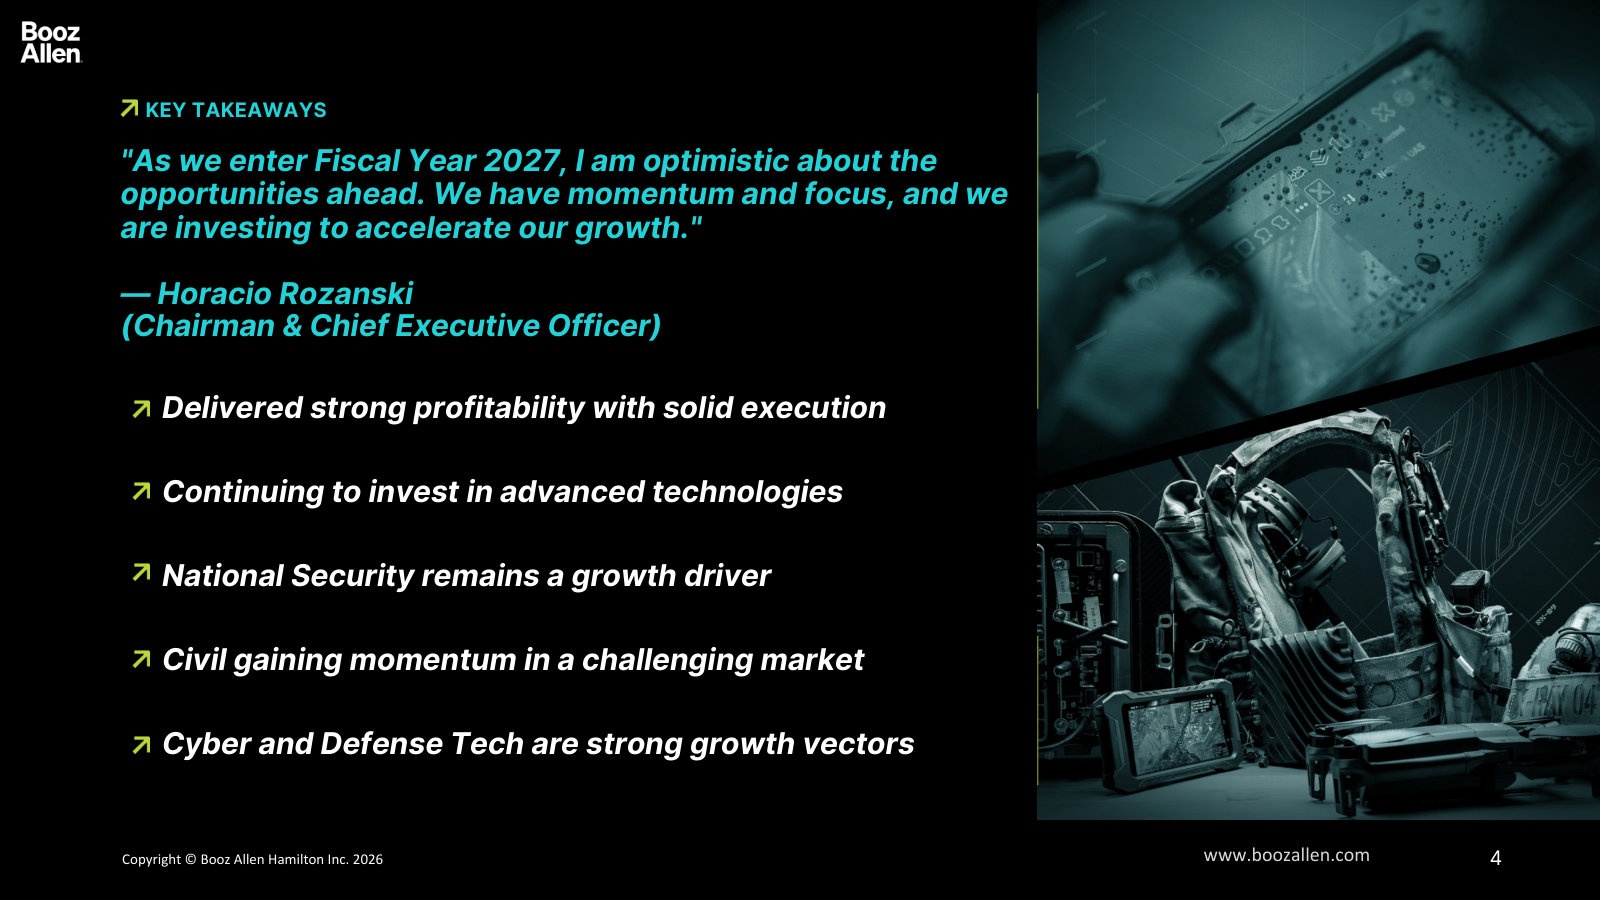
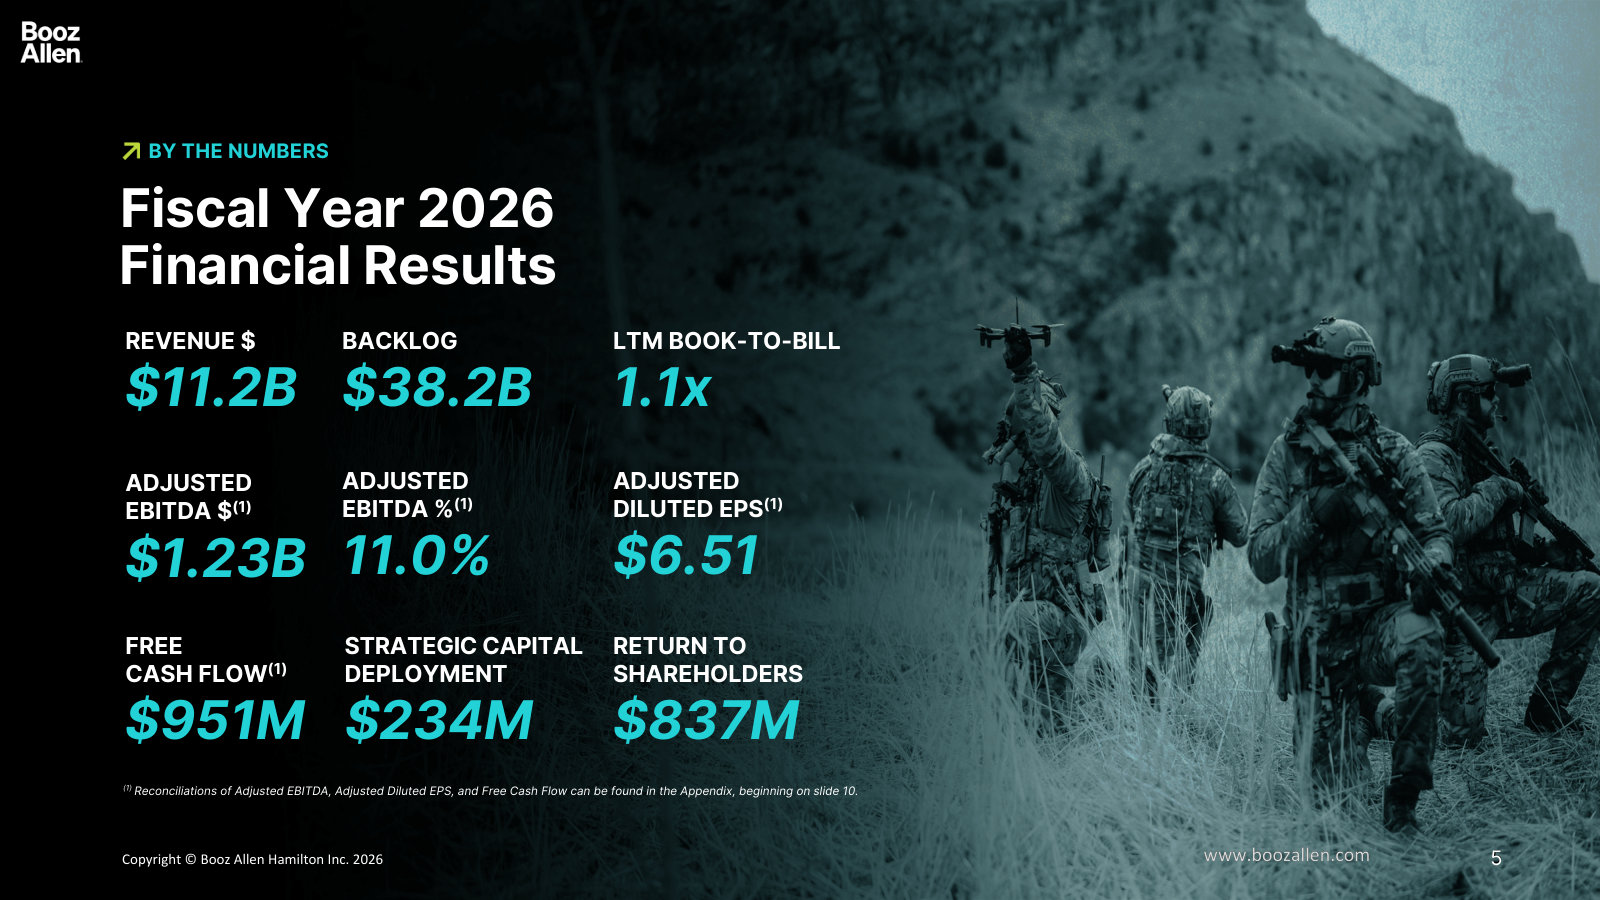
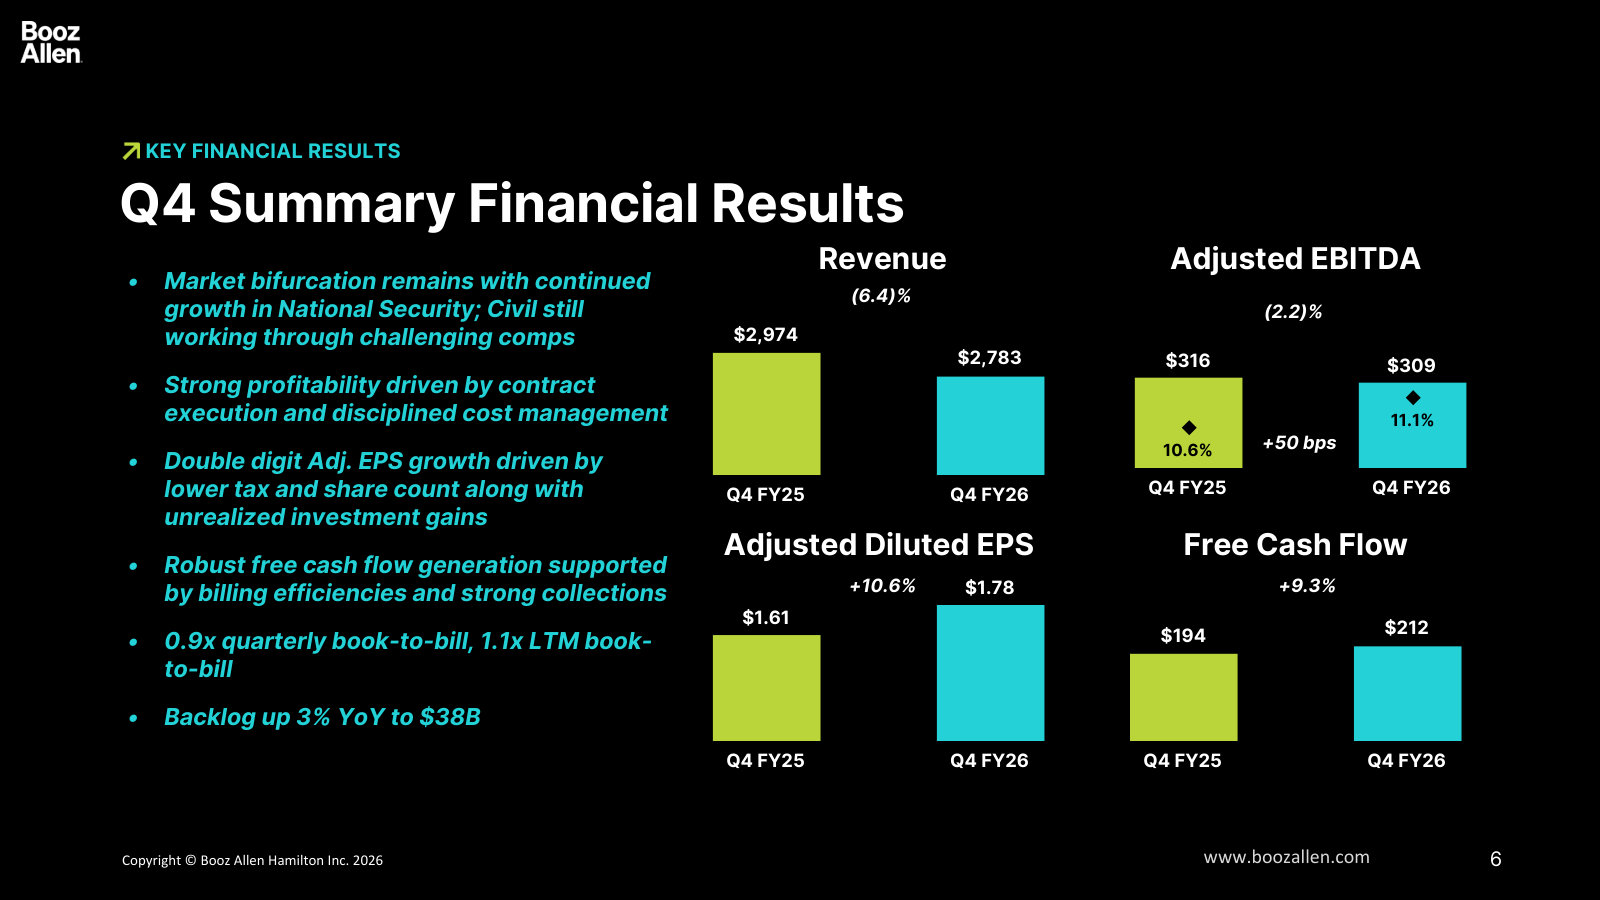
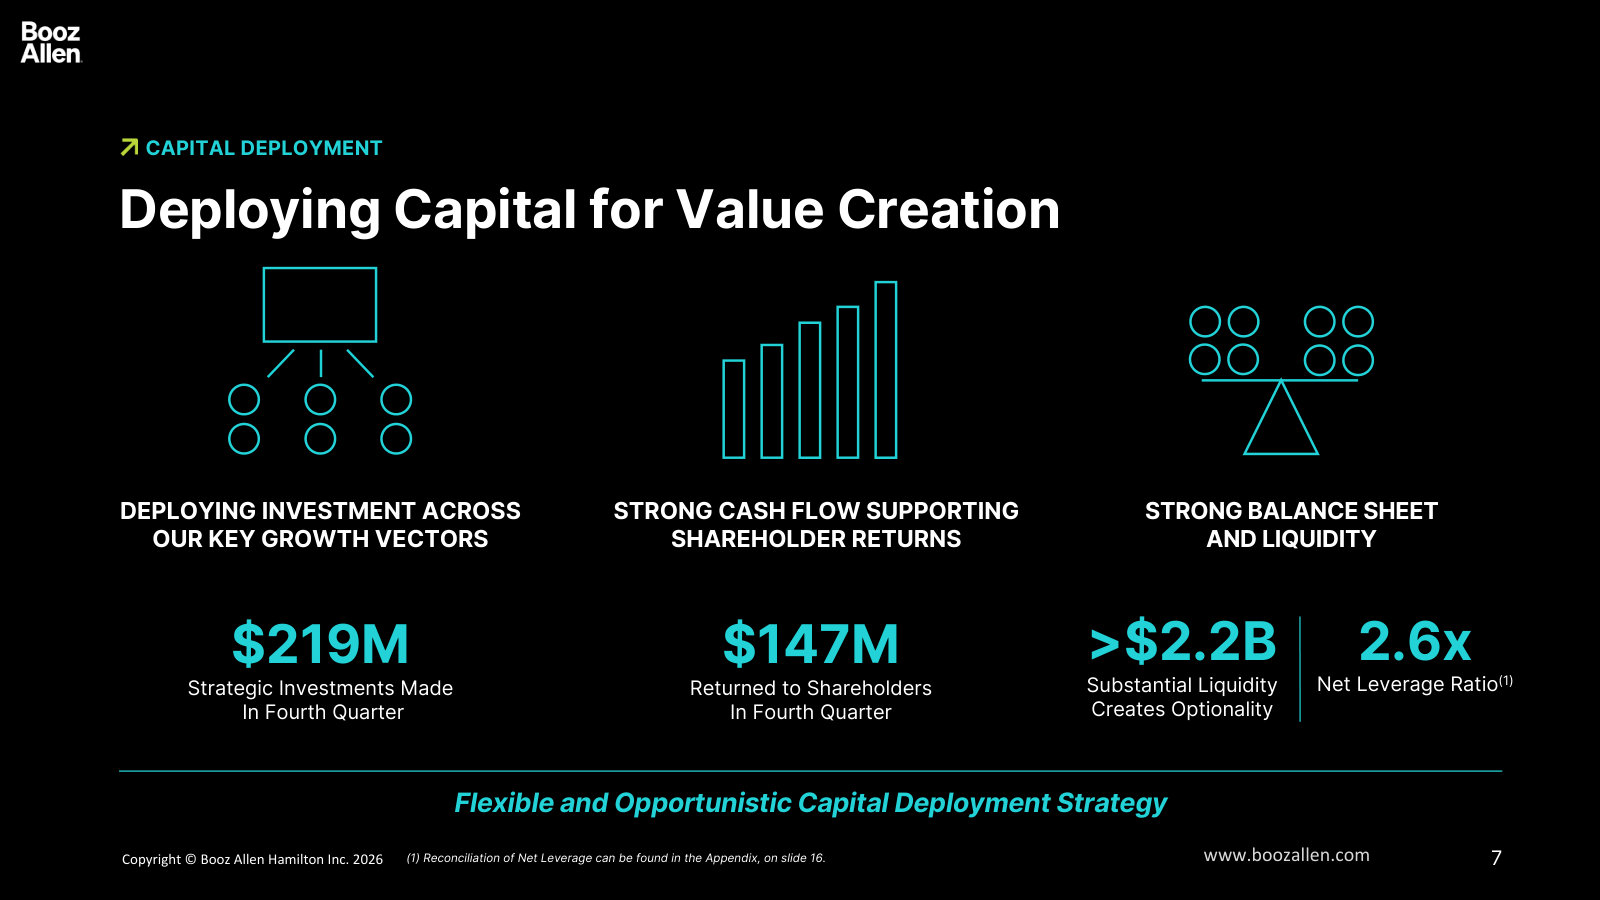
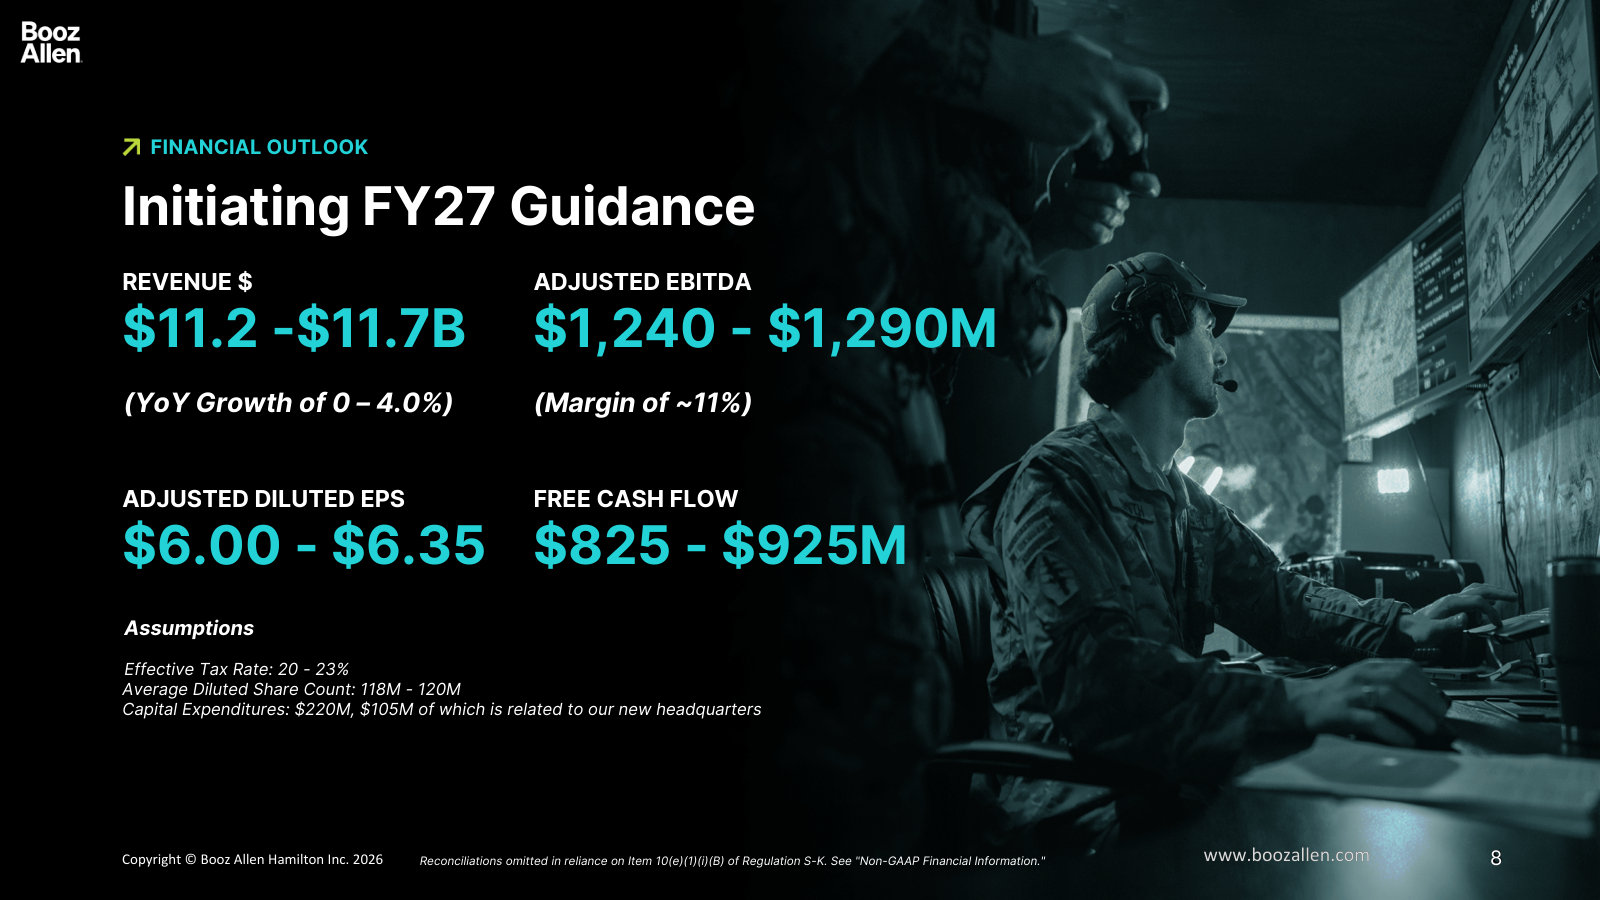
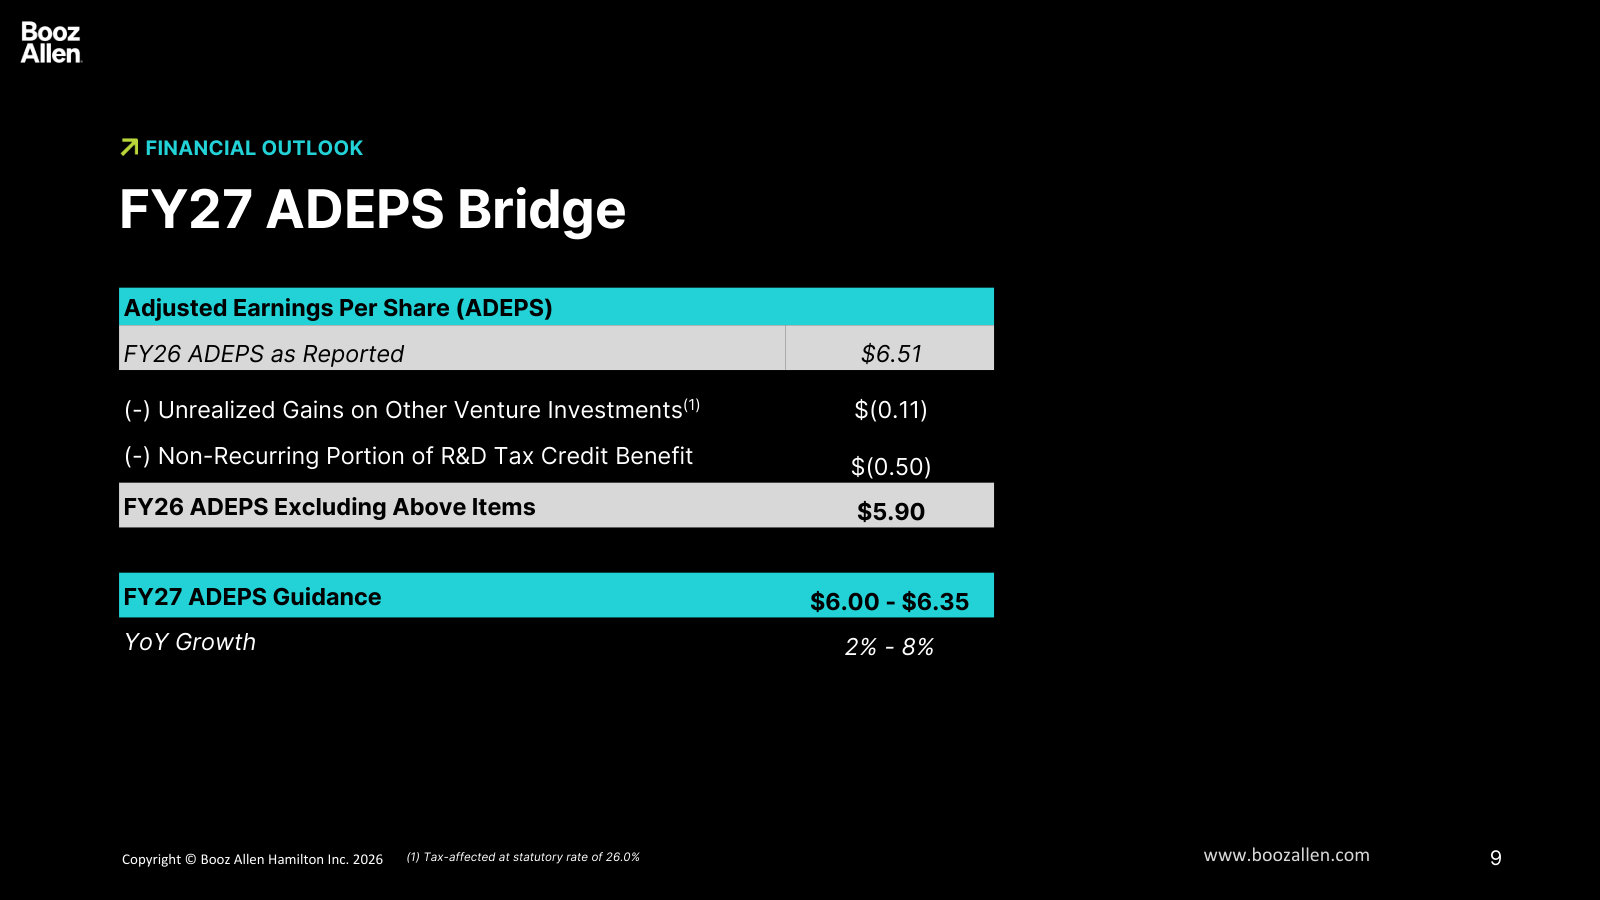
p. 4 — Key takeaways: the CEO's read on FY2027 and the four demand drivers — National Security, Civil, Cyber, and Defense Tech. · Open the full presentation →p. 5 — FY2026 on one page: $11.2B revenue, $38.2B backlog, 1.1x book-to-bill, 11% EBITDA margin, $951M free cash flow. · Open the full presentation →p. 6 — Q4 in four charts: National Security still growing while Civil works through weaker comps — the market split management flags. · Open the full presentation →p. 7 — How capital is deployed — strategic investment, shareholder returns, and a 2.6x-levered balance sheet with $2.2B of liquidity. · Open the full presentation →p. 8 — Initial FY2027 guidance: 0–4% revenue growth, ~11% EBITDA margin, $6.00–6.35 adjusted EPS, and the underlying assumptions. · Open the full presentation →p. 9 — Adjusted-EPS bridge: strips one-off venture gains and an R&D tax benefit out of FY2026 to set the FY2027 base. · Open the full presentation →
The FY2025 deck, notable for grading management's completed FY2023–2025 investment thesis against the targets it set. · Open the full document →
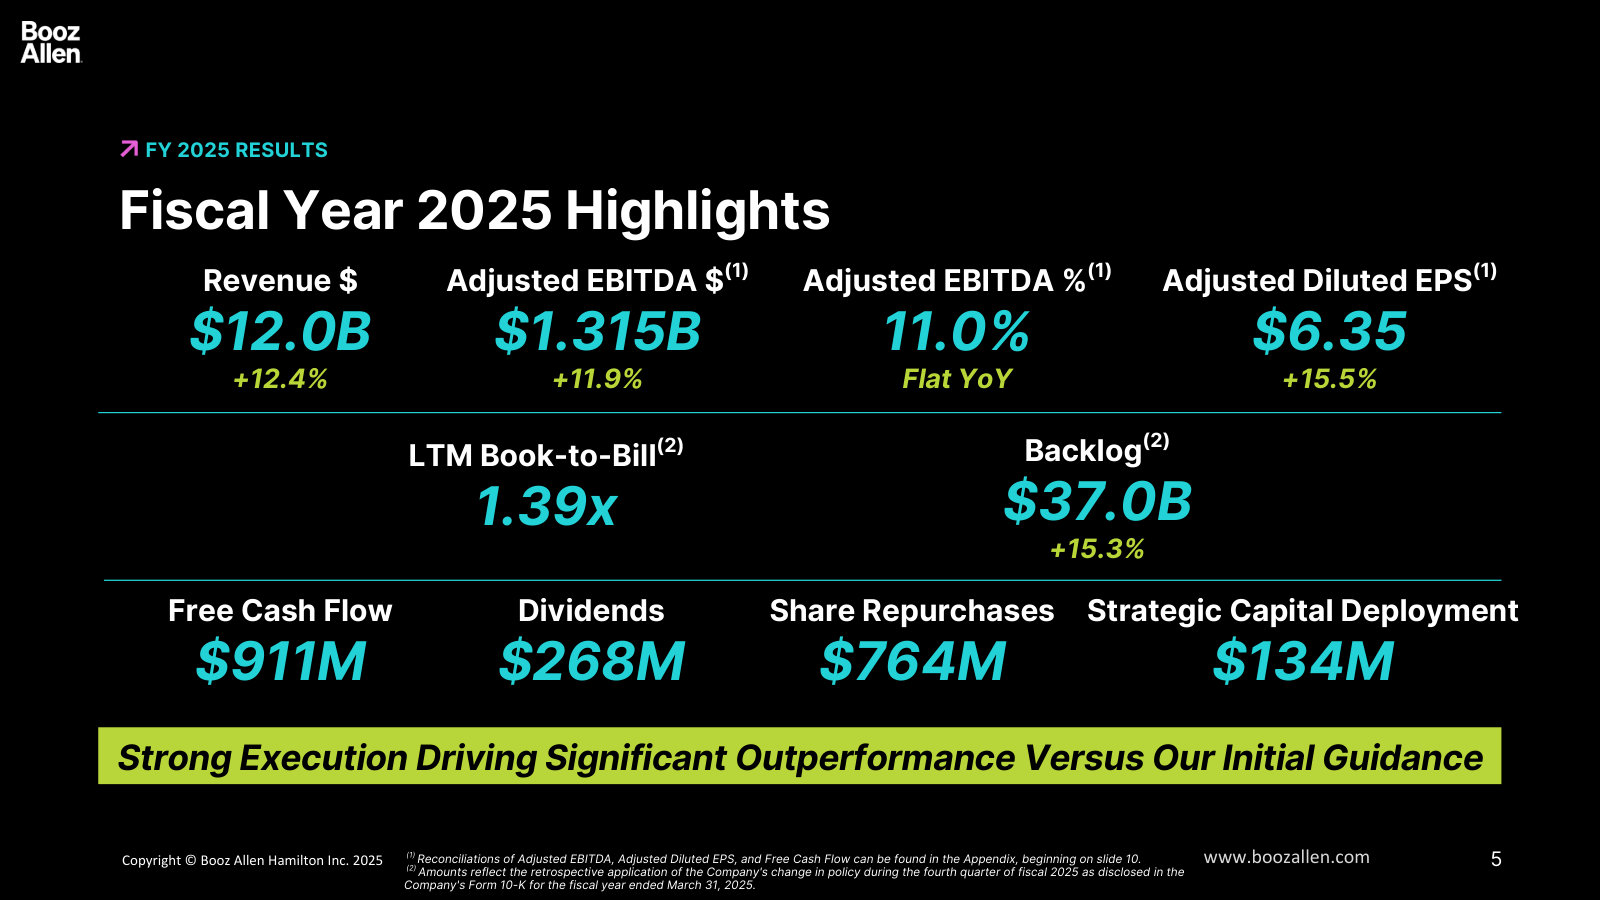
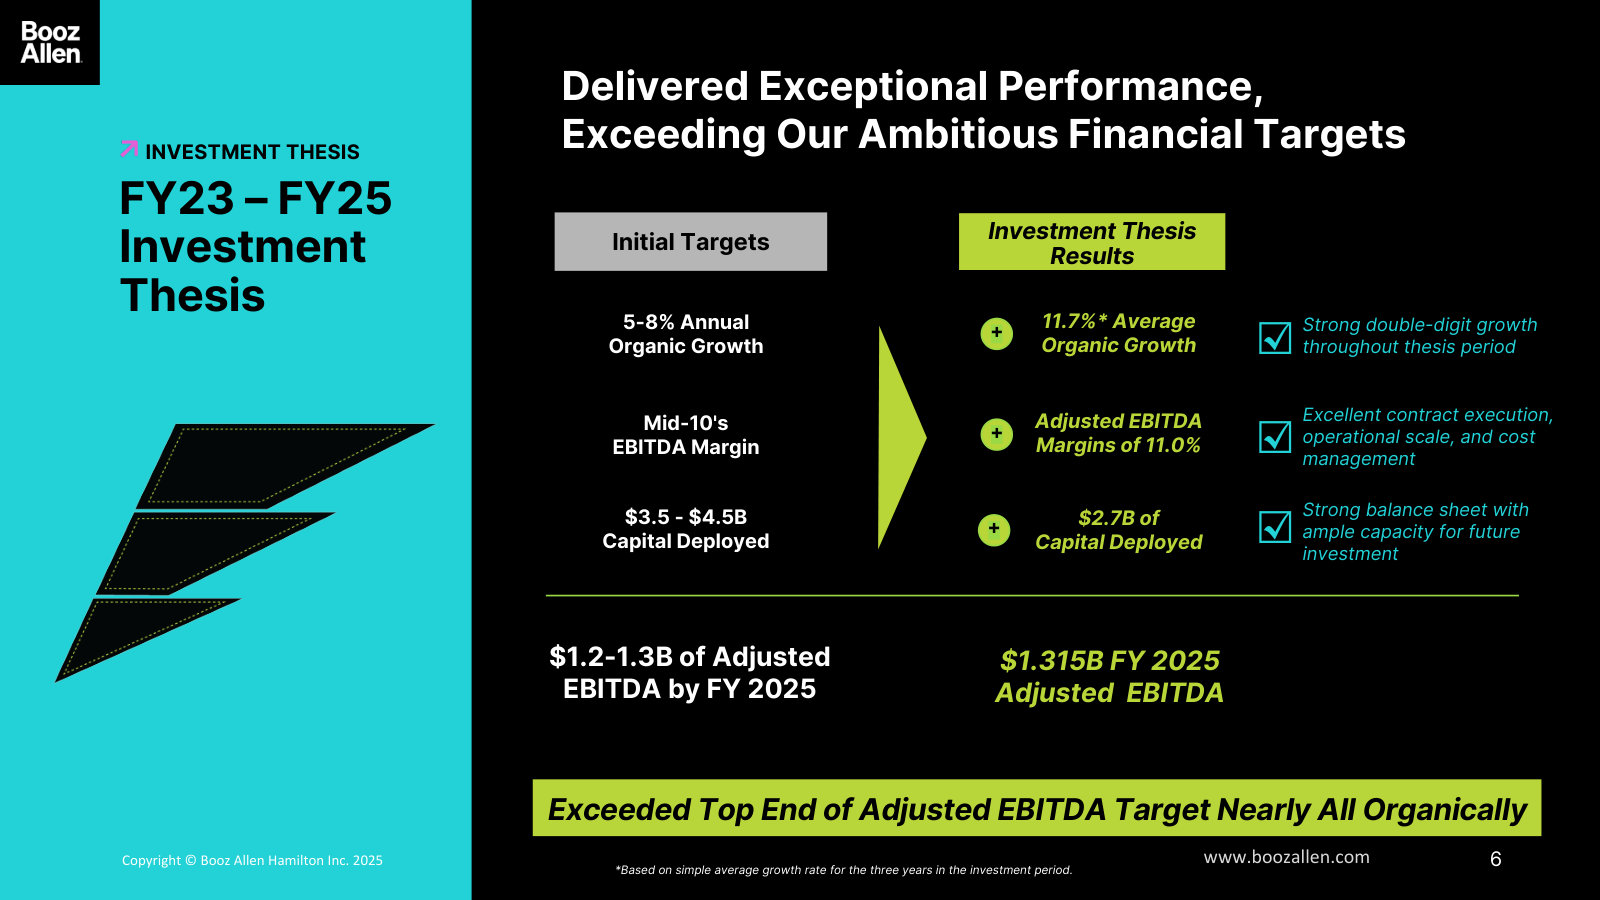
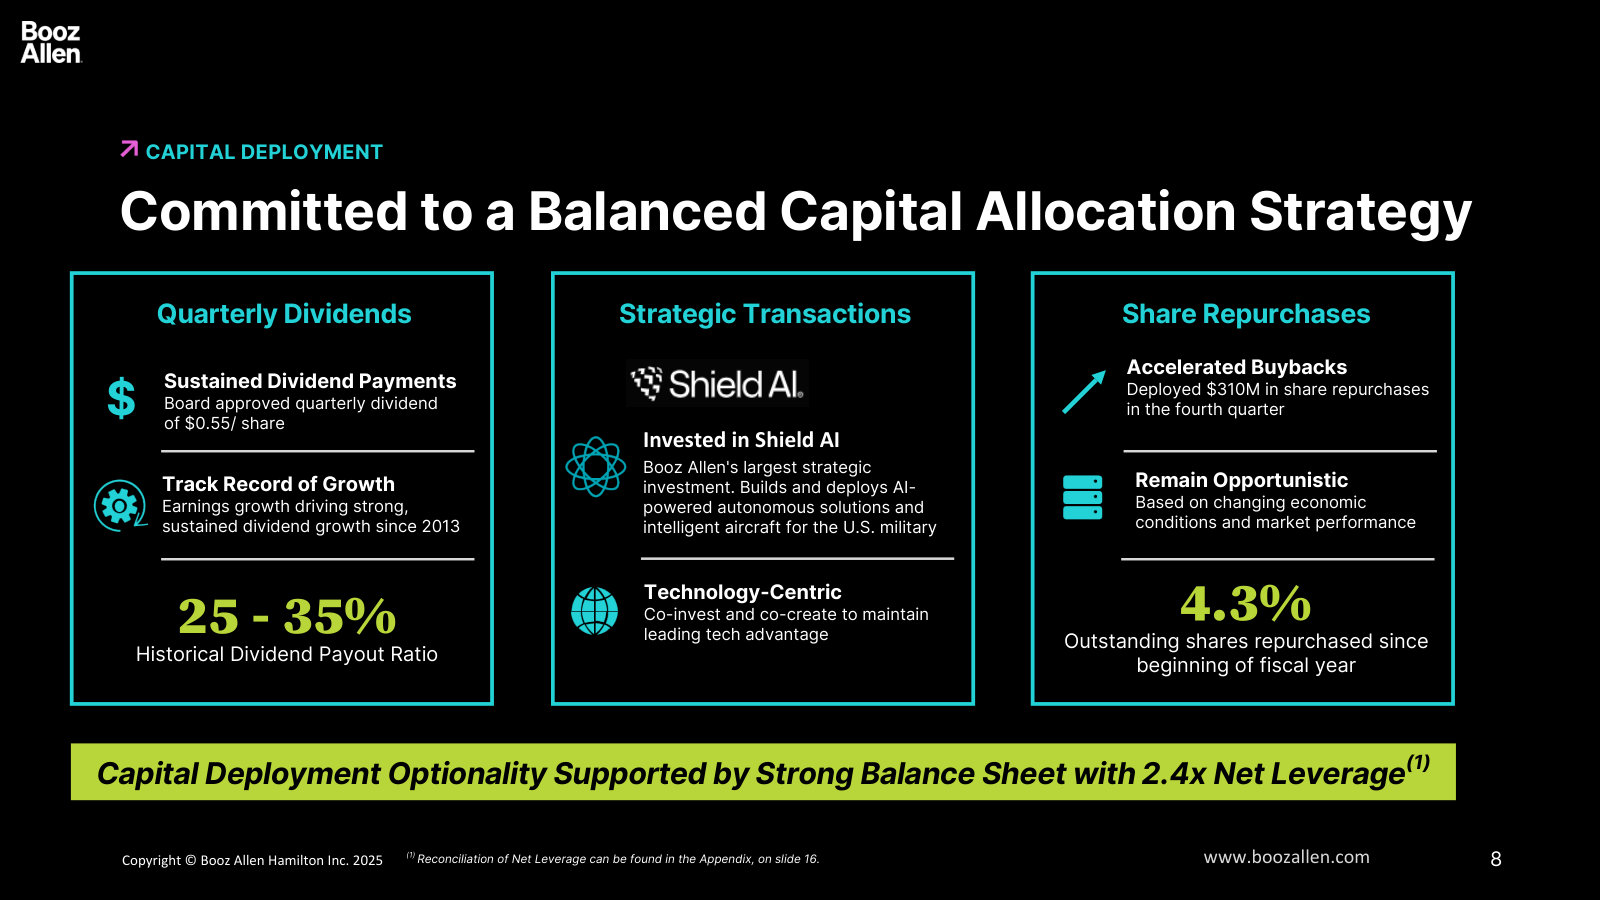
p. 5 — FY2025 scorecard: $12.0B revenue (+12%), 1.39x book-to-bill, $37B backlog, and how the year's cash was returned. · Open the full presentation →p. 6 — The three-year plan graded: organic growth, EBITDA margin, and capital-deployment targets versus what was delivered. · Open the full presentation →p. 8 — Capital allocation in detail — the dividend, the Shield AI strategic stake, and buybacks against a 2.4x-levered balance sheet. · Open the full presentation →
The FY2024 deck, in the older format that still carried the business-model charts — demand pipeline and capital history later decks dropped. · Open the full document →
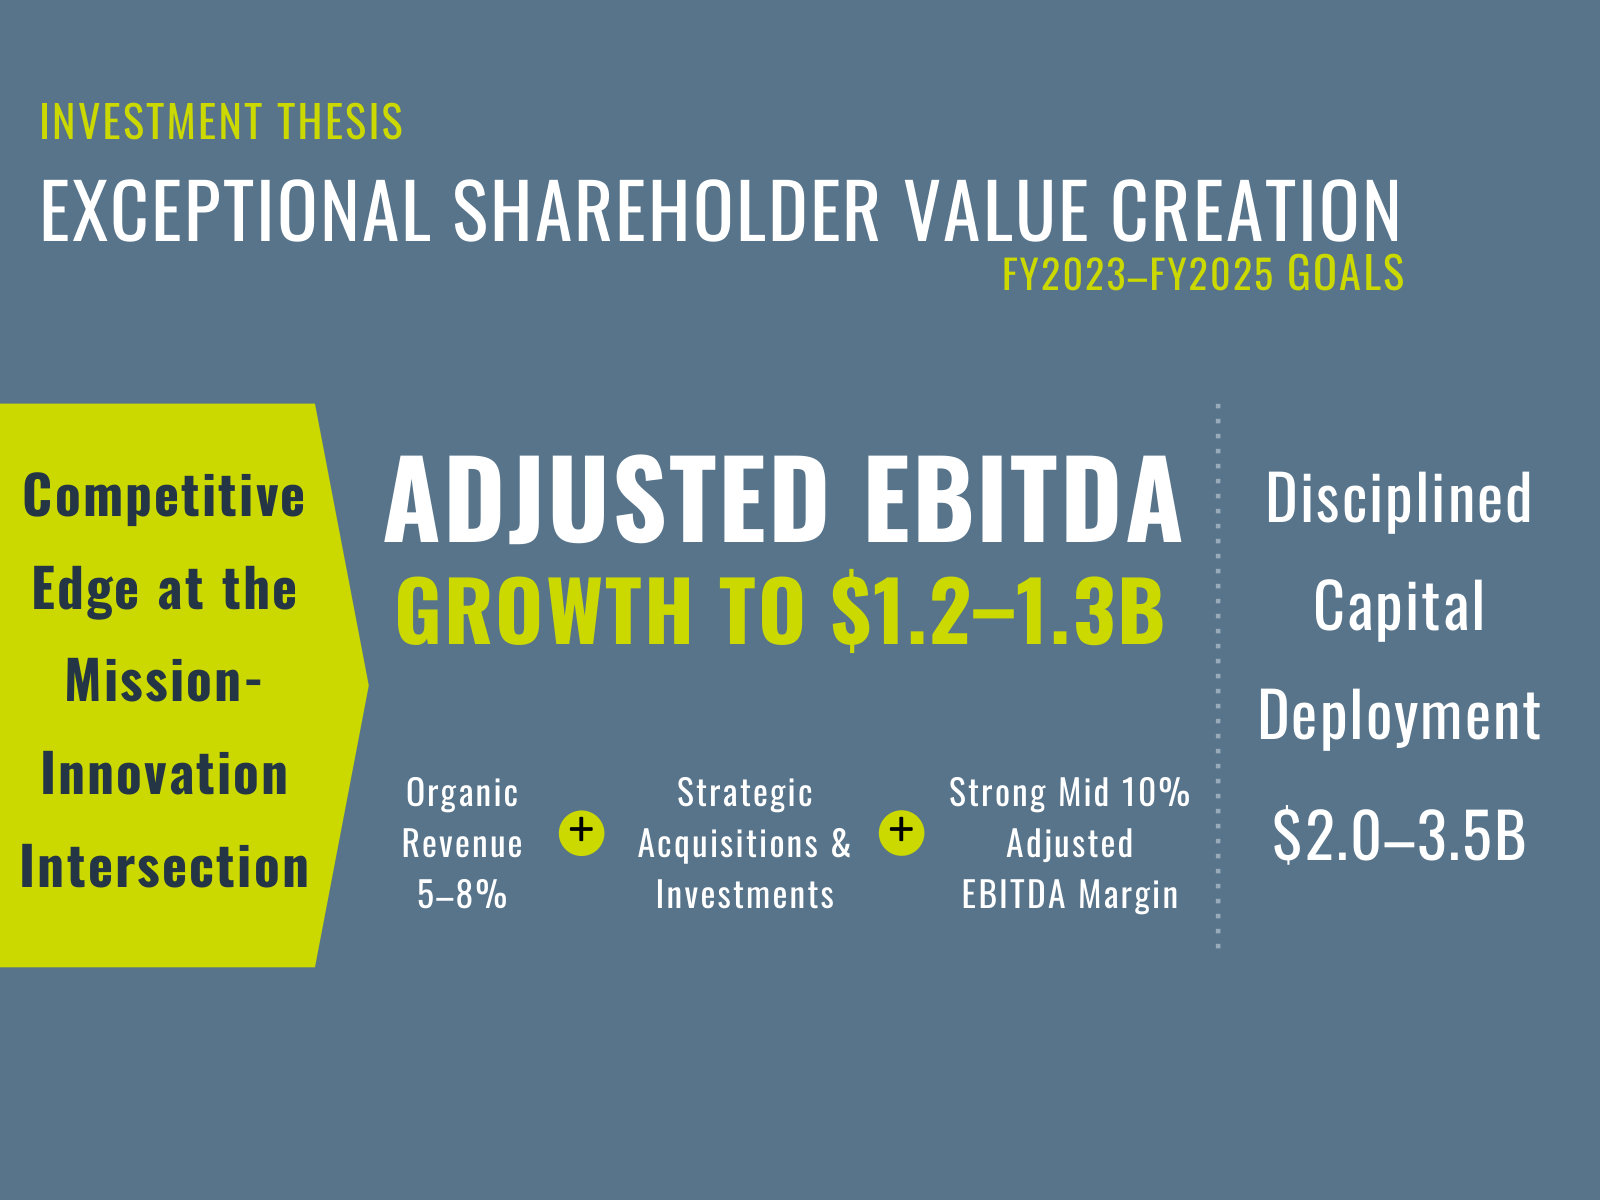
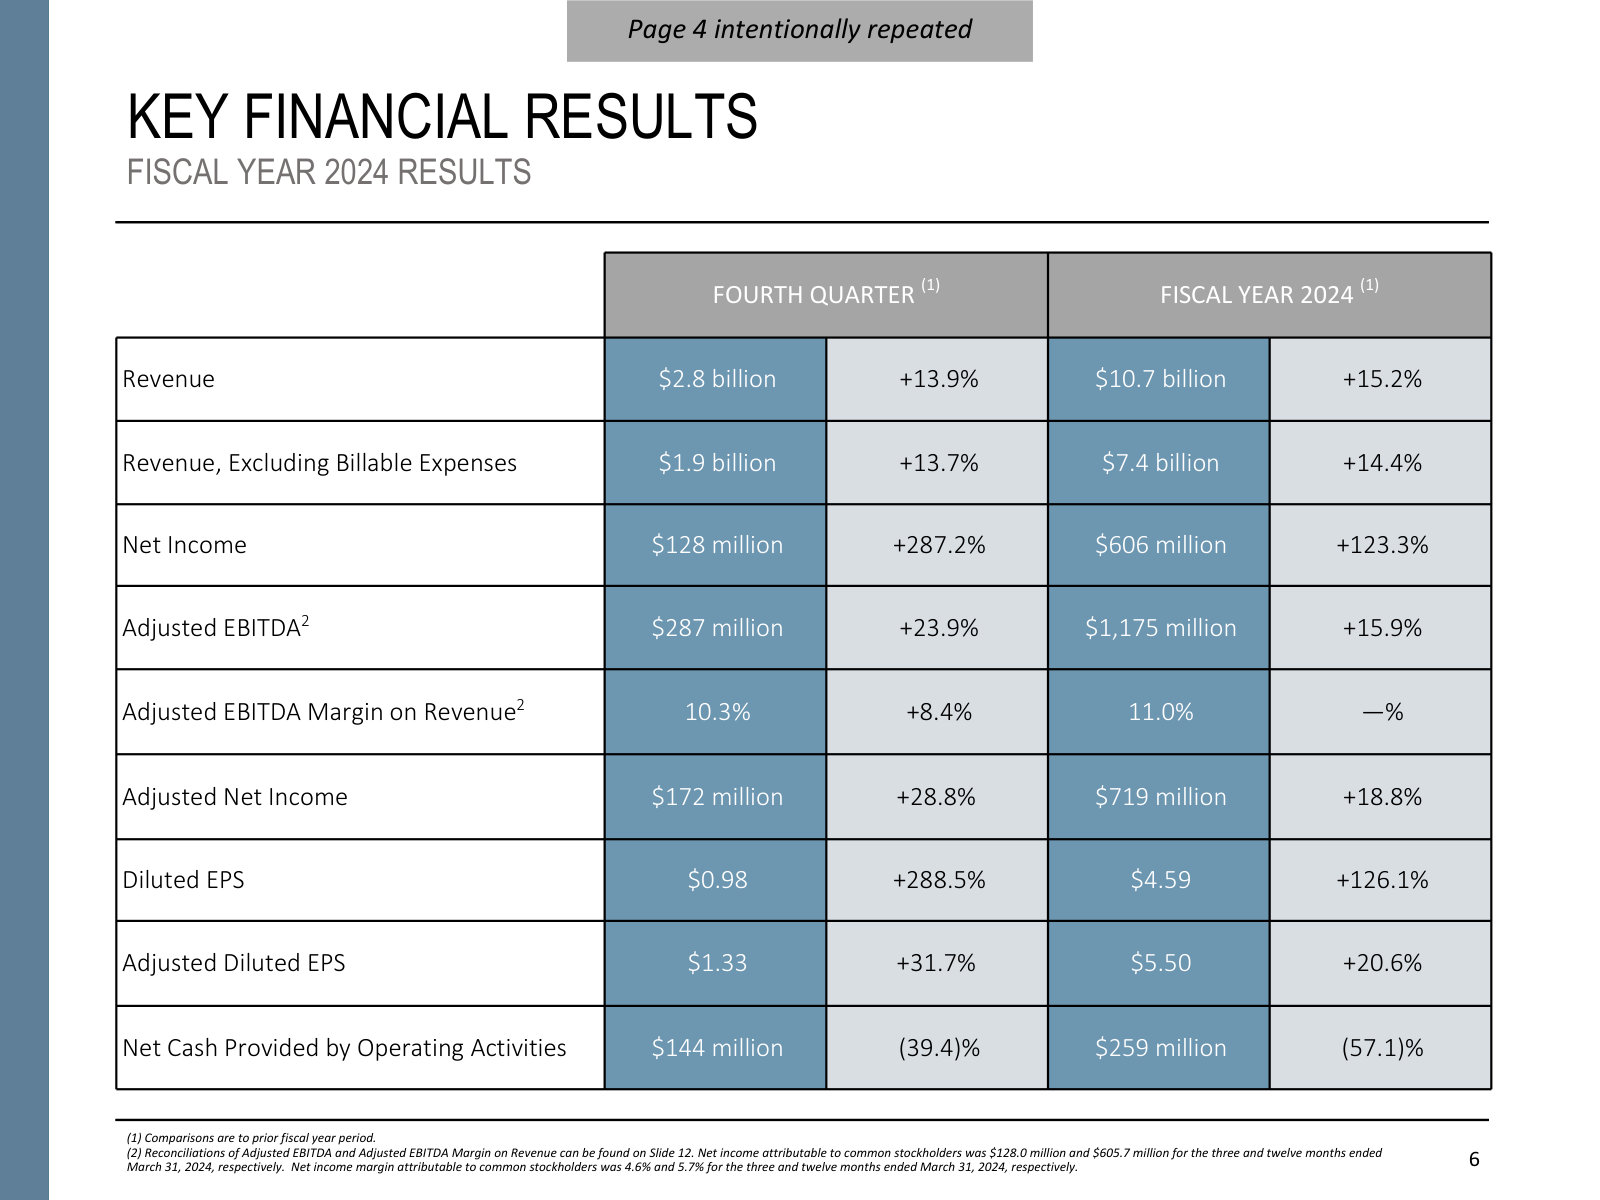
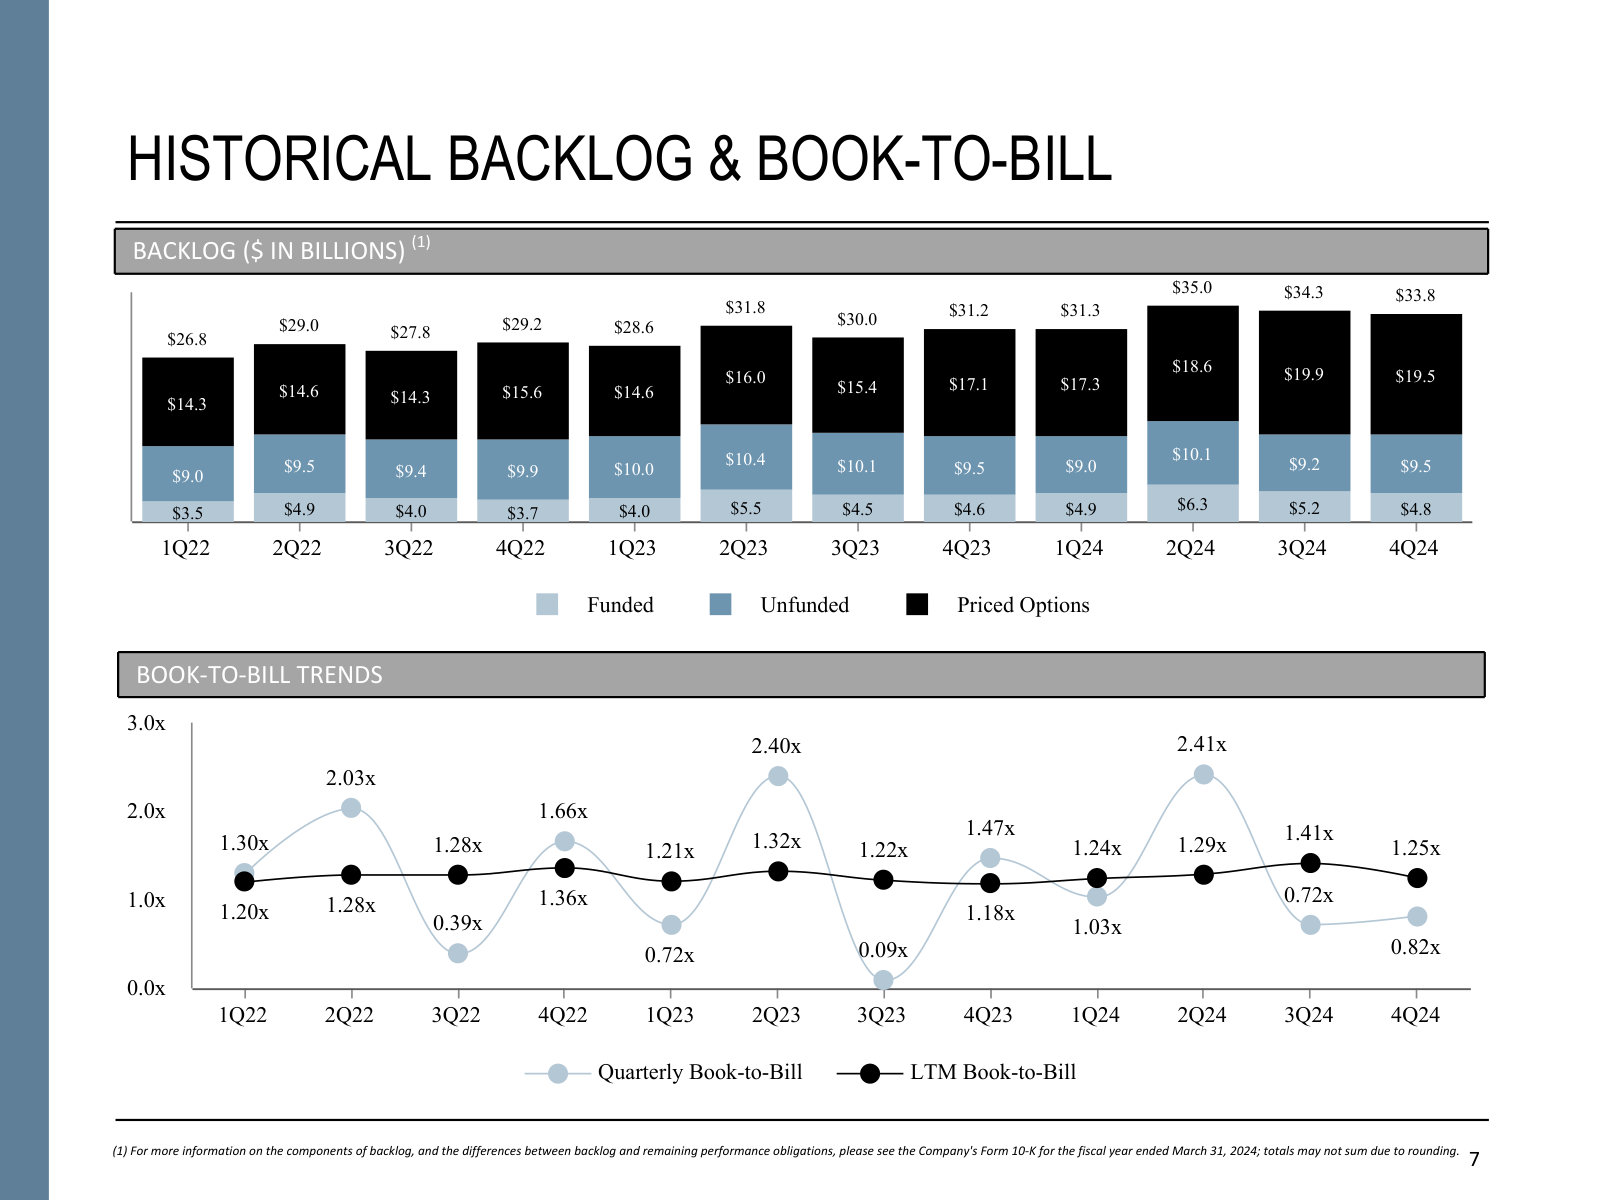
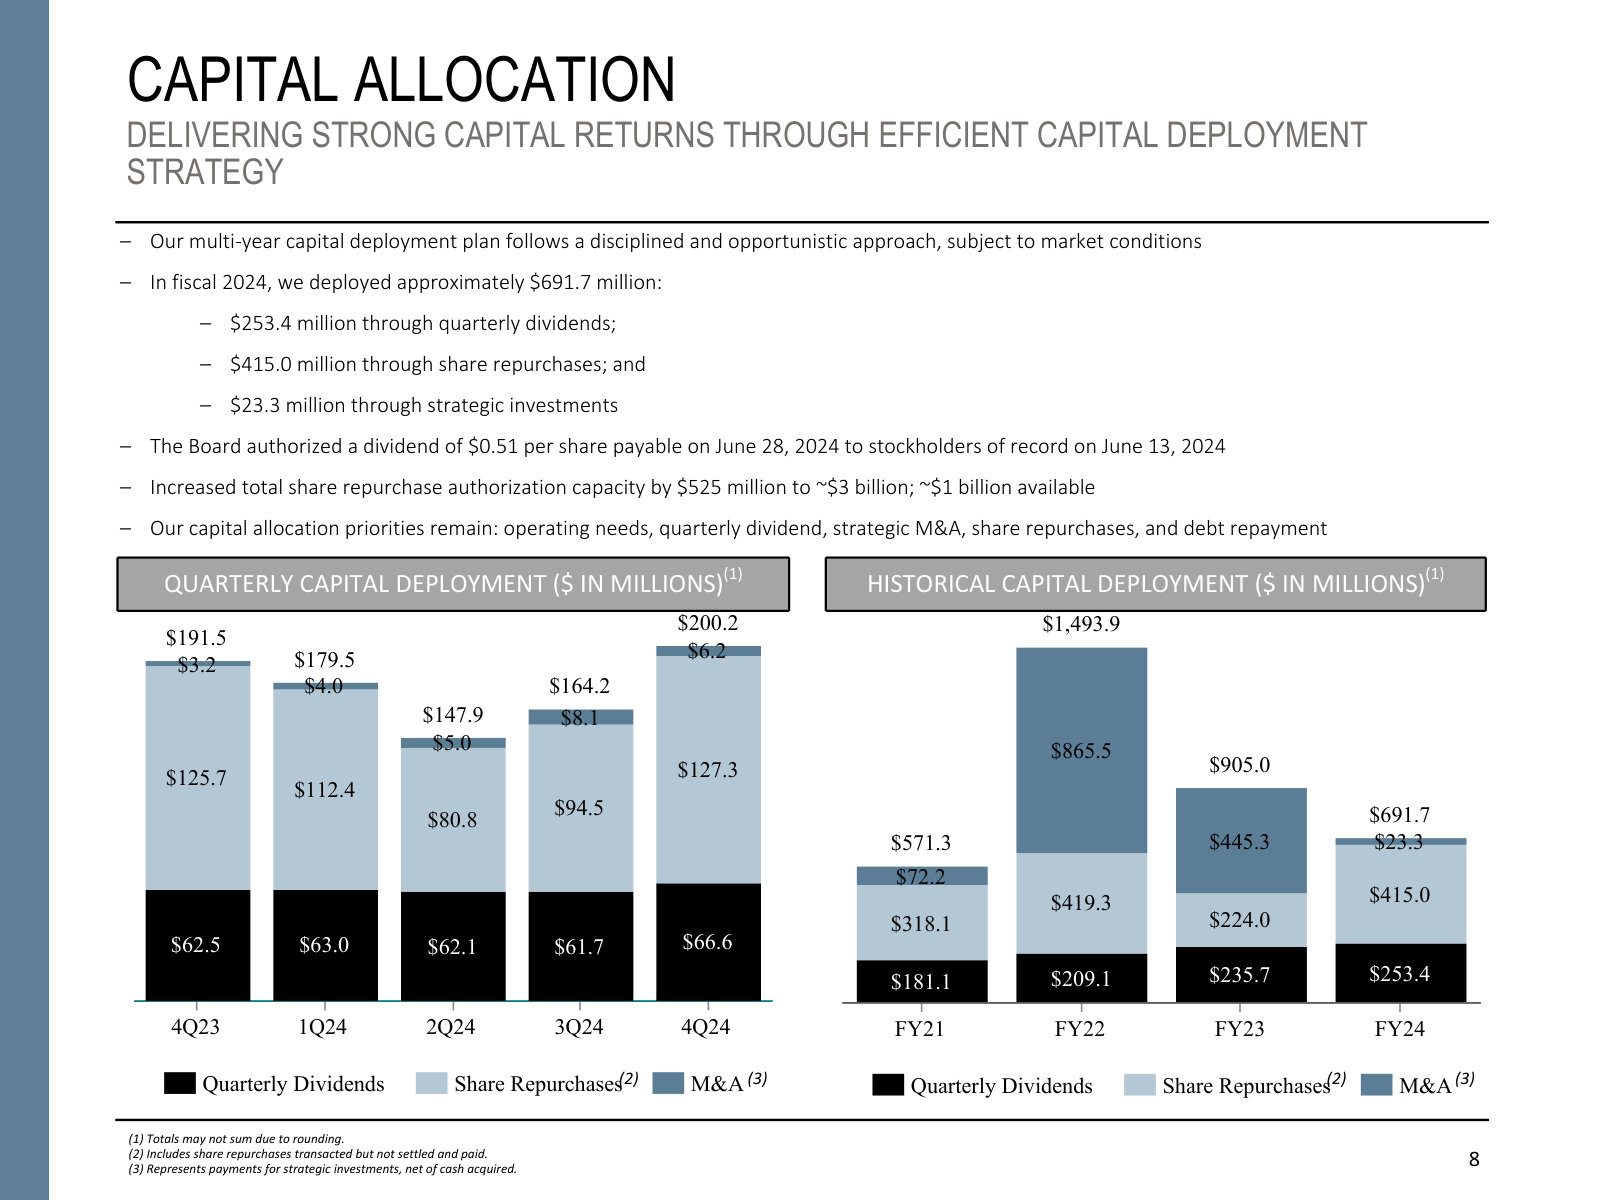
p. 5 — The FY2023–2025 strategy framework: the 'mission-innovation intersection' plus the growth, margin, and capital goals. · Open the full presentation →p. 6 — Full-year and Q4 income statement in one table — revenue, revenue ex-billables, EBITDA, net income, and EPS. · Open the full presentation →p. 7 — Backlog and book-to-bill history — how a government contractor's pipeline (funded, unfunded, priced options) builds over time. · Open the full presentation →p. 8 — Capital deployment by year and quarter — the split across dividends, buybacks, and M&A from FY2021 to FY2024. · Open the full presentation →
Q3 FY2026 Earnings Presentation — Q3 FY2026 · 17 pages · The interim quarter before the FY2026 annual deck, with a guidance-range crosswalk for the year. · Open →
Q2 FY2026 Earnings Presentation — Q2 FY2026 · 16 pages · Mid-year FY2026 update; same financial-summary format as the featured annual decks. · Open →
Q2 FY2025 Earnings Presentation — Q2 FY2025 · 17 pages · The quarter that revised FY2025 guidance and walked through three discrete items behind the change. · Open →