Full Report
The numbers behind Booz Allen Hamilton Holding Corporation: as-reported financial statements and company metrics for FY2022–FY2026, traced to the source filings, opened with the share-price history those statements have to justify. Every linked figure opens the exact page of the filing it was printed on, with the statement row highlighted. Amounts in US$ millions unless noted.
Reading notes: Display scale is US$ millions for the whole tab. BAH's FY2022, FY2023 and FY2024 Form 10-Ks print the primary statements in thousands; FY2025 and FY2026 print in millions. Values are shown in millions; each citation anchor is the figure exactly as printed on the cited page (thousands for FY2022-FY2024, millions for FY2025-FY2026). Each of FY2022-FY2026 is cited to that fiscal year's own Form 10-K (income statement, balance sheet, cash-flow statement). Fiscal year ends March 31. Revenue breakdown uses BAH's reported 'Revenue by Customer Type' disaggregation (Note 3). FY2024 and the reclassified FY2025/FY2026 comparatives are read from the FY2026 10-K note; FY2023 and FY2025 from the FY2025 10-K note. FY2022 is from the standardized data feed on the reclassified basis (unlinked). Backlog KPIs are the MD A (Item 7) figures, which match the data feed. Total and Funded backlog are cited FY2024-FY2026; FY2022-FY2023 (older Item 1 basis) and Book-to-Bill (all years) are from the data feed and shown without page links.
Share Price — Full Available History — 16 Years
The stock closed at $65.87 on Jul 24, 2026 — up 242% over the window shown (+8.2% a year), trading between $11.90 and $186.00. At that close the stock trades at 9.5× FY2026 diluted EPS as reported below.
Source: market price feed, monthly closes, sampled from 3,944 source observations, Nov 2010–Jul 2026. Price return only, excludes dividends.
Market capitalization $9.9bn and enterprise value $13.1bn.
Market cap = 150.3M shares outstanding × the Jul 24, 2026 close of $65.87. Enterprise value adds total debt of $3.9bn and subtracts cash and equivalents of $728mn (net debt of $3.2bn), from the FY2026 balance sheet. Market-derived figures, shown without filing links.
FY2026 at a Glance
Revenue (US$ millions)
Operating income (US$ millions)
Net income (US$ millions)
Diluted EPS
Source: FY2026 consolidated statements [1] [2] [3] [4]. Click any linked figure to open the filing page with the row highlighted.
Revenue by Customer Type
| Revenue by Customer Type | FY2022 | FY2023 | FY2024 | FY2025 | FY2026 |
|---|---|---|---|---|---|
| Defense Customers | 3,966 | 4,230 | 5,061 | 5,943 | 6,069 |
| Intelligence Customers | 1,573 | 1,684 | 1,763 | 1,867 | 1,900 |
| Civil and Commercial Customers | 2,825 | 3,345 | 3,838 | 4,170 | 3,248 |
| Total Revenue | 8,364 | 9,259 | 10,662 | 11,980 | 11,217 |
| Total Revenue growth, derived | — | +10.7% | +15.2% | +12.4% | -6.4% |
Source: Form 10-K Note 3, Revenue — Disaggregation of Revenue (reclassified basis beginning FY2025; FY2022 from standardized data feed) [5] [6]. Click any linked figure to open the filing page with the row highlighted.
Income Statement
Source: Consolidated Statements of Operations [1] [2] [3] [4]. Click any linked figure to open the filing page with the row highlighted.
Columns marked E are consensus analyst estimates from S&P Capital IQ (CapIQ), shown alongside reported results for direct comparison; they are not company guidance.
Estimate source: S&P Capital IQ (CapIQ) consensus, as of 2026-07-24. Estimate figures are S&P Capital IQ consensus (vendor data — no filing page links). EPS and net income use the normalized (adjusted) consensus where the street reports it. Line-item analyst models (segments, drivers, KPIs) are in the Visible Alpha tab.
Balance Sheet
Source: Consolidated Balance Sheets [7] [8] [9] [10]. Click any linked figure to open the filing page with the row highlighted.
Cash Flow
Source: Consolidated Statements of Cash Flows [11] [12] [13] [14]. Click any linked figure to open the filing page with the row highlighted.
Non-GAAP Performance Measures
| Non-GAAP Performance Measures | FY2022 | FY2023 | FY2024 | FY2025 | FY2026 |
|---|---|---|---|---|---|
| Revenue, Excluding Billable Expenses | 5,890 | 6,450 | 7,380 | 8,200 | 7,767 |
| Adjusted EBITDA | 935 | 1,014 | 1,175 | 1,315 | 1,229 |
| Adjusted EBITDA Margin on Revenue | 11.2% | 11.0% | 11.0% | 11.0% | 11.0% |
| Adjusted Net Income | 568 | 605 | 719 | 815 | 797 |
| Adjusted Diluted EPS | 4.21 | 4.56 | 5.50 | 6.35 | 6.51 |
| Free Cash Flow | 657 | 527 | 192 | 911 | 951 |
Source: company filings [15] [16] [17] [18]. Click any linked figure to open the filing page with the row highlighted.
Revenue by Contract Type
| Revenue by Contract Type | FY2022 | FY2023 | FY2024 | FY2025 | FY2026 |
|---|---|---|---|---|---|
| Cost-reimbursable (% of revenue) | 54.0% | 53.0% | 55.0% | 57.0% | 59.0% |
| Time-and-materials (% of revenue) | 24.0% | 25.0% | 24.0% | 23.0% | 22.0% |
| Fixed-price (% of revenue) | 22.0% | 22.0% | 21.0% | 20.0% | 19.0% |
Source: company filings [19] [20]. Click any linked figure to open the filing page with the row highlighted.
Workforce Capital Returns
| Workforce Capital Returns | FY2022 | FY2023 | FY2024 | FY2025 | FY2026 |
|---|---|---|---|---|---|
| Total employees (period end) | 29,300 | 31,900 | 34,200 | 35,800 | 31,500 |
| Dividends paid per share | 1.54 | 1.76 | 1.92 | 2.08 | 2.24 |
| Weighted-average diluted shares outstanding | 134,850,808 | 132,716,436 | 130,815,903 | 128,290,417 | 122,375,151 |
Source: company filings [15] [17] [21] [22]. Click any linked figure to open the filing page with the row highlighted.
Long-Term Record
| Fiscal year | Total revenue | Operating income | Net income | Diluted EPS | Operating cash flow |
|---|---|---|---|---|---|
| FY2017 | 5,809 | 506 | 261 | 1.72 | 382 |
| FY2018 | 6,168 | 520 | 302 | 2.03 | 369 |
| FY2019 | 6,704 | 602 | 419 | 2.91 | 500 |
| FY2020 | 7,464 | 669 | 483 | 3.41 | 551 |
| FY2021 | 7,859 | 754 | 609 | 4.37 | 719 |
| FY2022 | 8,364 | 685 | 467 | 3.44 | 737 |
| FY2023 | 9,259 | 447 | 272 | 2.03 | 603 |
| FY2024 | 10,662 | 1,013 | 606 | 4.59 | 259 |
| FY2025 | 11,980 | 1,370 | 935 | 7.25 | 1,009 |
| FY2026 | 11,217 | 1,033 | 851 | 6.90 | 1,041 |
Source: consolidated statements across filings; older years from the standardized feed [11] [1] [12] [2]. Click any linked figure to open the filing page with the row highlighted.
Operating KPIs
| KPI | FY2022 | FY2023 | FY2024 | FY2025 | FY2026 |
|---|---|---|---|---|---|
| Total Backlog | 29,247 | 31,202 | 32,113 | 37,027 | 38,187 |
| Funded Backlog | 3,710 | 4,619 | 4,187 | 4,421 | 4,319 |
| Book-to-Bill Ratio | 1.36 | 1.18 | 1.22 | 1.39 | 1.10 |
Source: company-reported operating metrics [23] [24]. Click any linked figure to open the filing page with the row highlighted.
Analyst Consensus
Mean target
Median target
High target
Low target
Street ratings: 3 strong buy, 8 hold, 2 sell, 1 strong sell. Consensus: Hold.
Estimate source: S&P Capital IQ (CapIQ) consensus, as of 2026-07-24. Estimate figures are S&P Capital IQ consensus (vendor data — no filing page links). EPS and net income use the normalized (adjusted) consensus where the street reports it. Line-item analyst models (segments, drivers, KPIs) are in the Visible Alpha tab.
Traceability
312 of 365 figures on this page (85%) link to the filing page where they are printed — click a linked figure to open the source PDF at that page with the row highlighted. Unlinked figures come from standardized data feeds or pre-filing years.
Display scale is US$ millions for the whole tab. BAH's FY2022, FY2023 and FY2024 Form 10-Ks print the primary statements in thousands; FY2025 and FY2026 print in millions. Values are shown in millions; each citation anchor is the figure exactly as printed on the cited page (thousands for FY2022-FY2024, millions for FY2025-FY2026).
Each of FY2022-FY2026 is cited to that fiscal year's own Form 10-K (income statement, balance sheet, cash-flow statement). Fiscal year ends March 31.
Revenue breakdown uses BAH's reported 'Revenue by Customer Type' disaggregation (Note 3). FY2024 and the reclassified FY2025/FY2026 comparatives are read from the FY2026 10-K note; FY2023 and FY2025 from the FY2025 10-K note. FY2022 is from the standardized data feed on the reclassified basis (unlinked).
Backlog KPIs are the MD A (Item 7) figures, which match the data feed. Total and Funded backlog are cited FY2024-FY2026; FY2022-FY2023 (older Item 1 basis) and Book-to-Bill (all years) are from the data feed and shown without page links.
FY2017-FY2021 long-term-record figures are from the standardized data feed / filings outside the corpus and are shown without page links.
Quarterly block covers the six most recent 10-Q quarters (Q1 FY2025-Q3 FY2026). Income statement uses the single-quarter (three-months-ended) column; balance sheet is point-in-time; cash-flow single quarters are derived from the printed year-to-date statements and reconcile exactly to the data feed's quarterly cash flow. Q2 FY2025 operating income and net income are elevated by a large gain recognized that quarter.
4 figure(s) differed between the data feed and the filing; the filing value is shown (see the run's metrics/metrics_tab.json for the audit trail).
Booz Allen Hamilton Holding Corporation's management explains the business in its own materials. The slides below do the most of that work, pulled from the documents preserved in Sources. Each source link opens the complete presentation at that slide in a new tab.
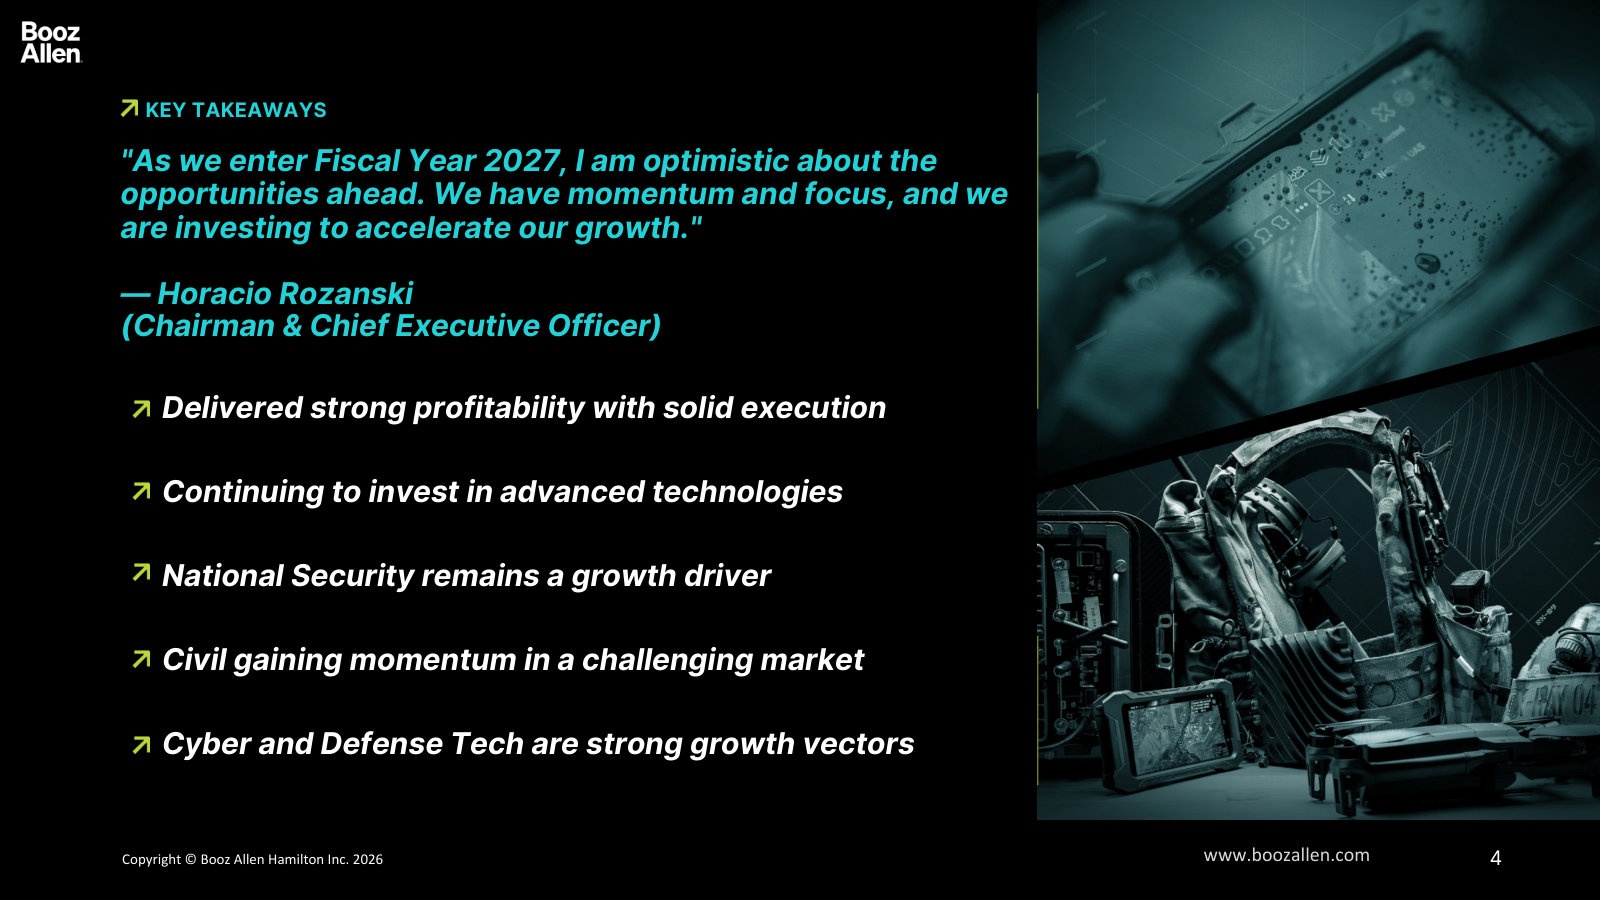
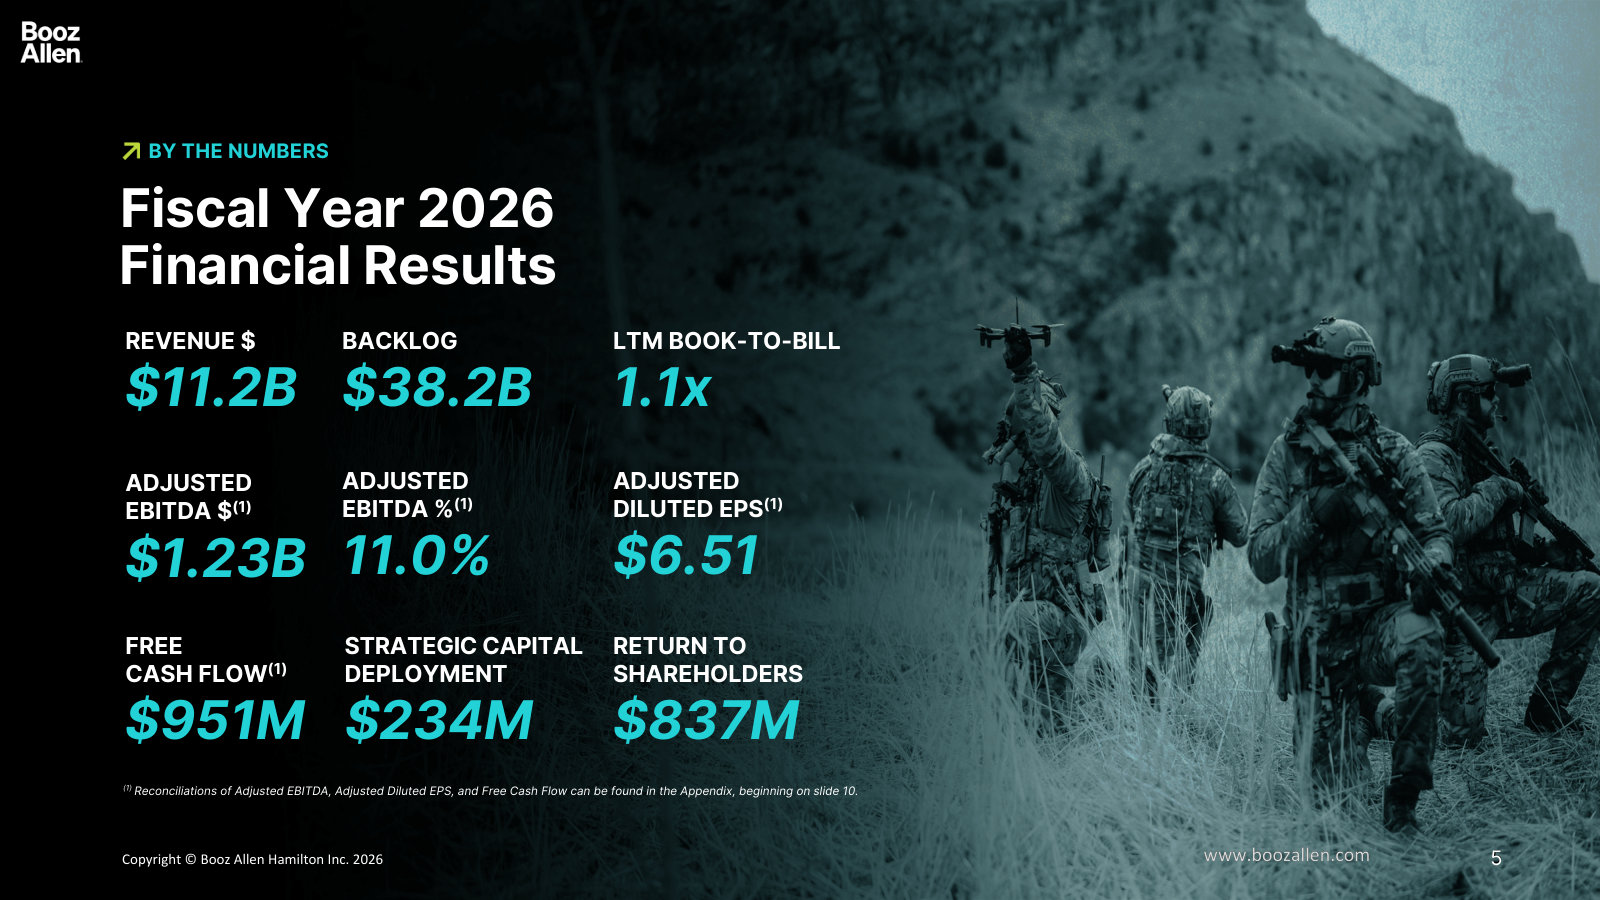
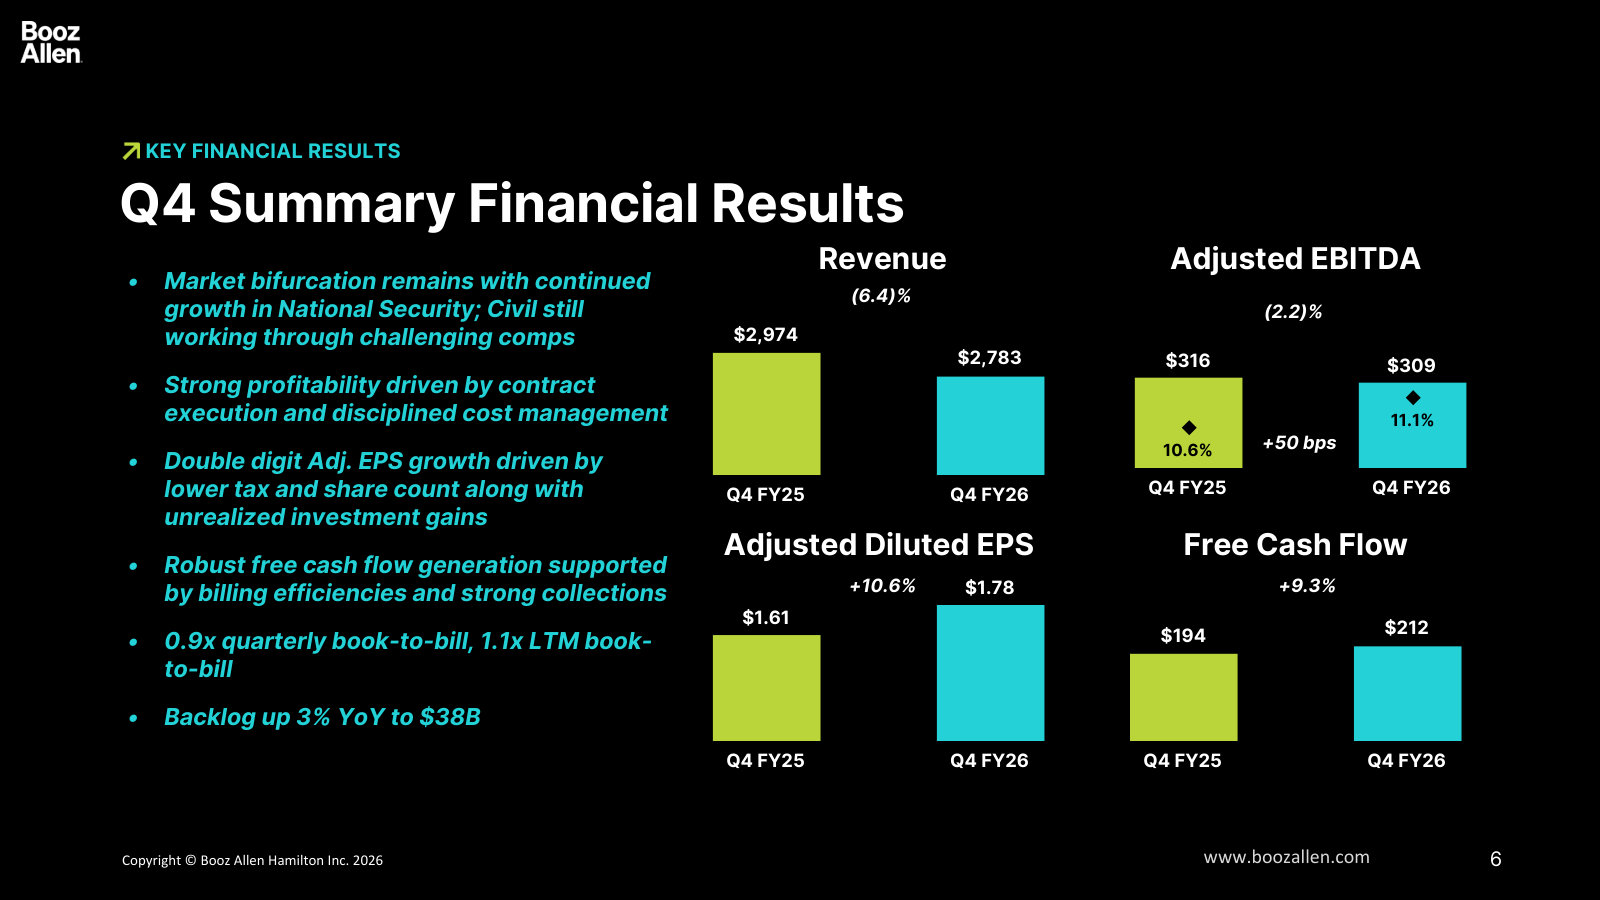
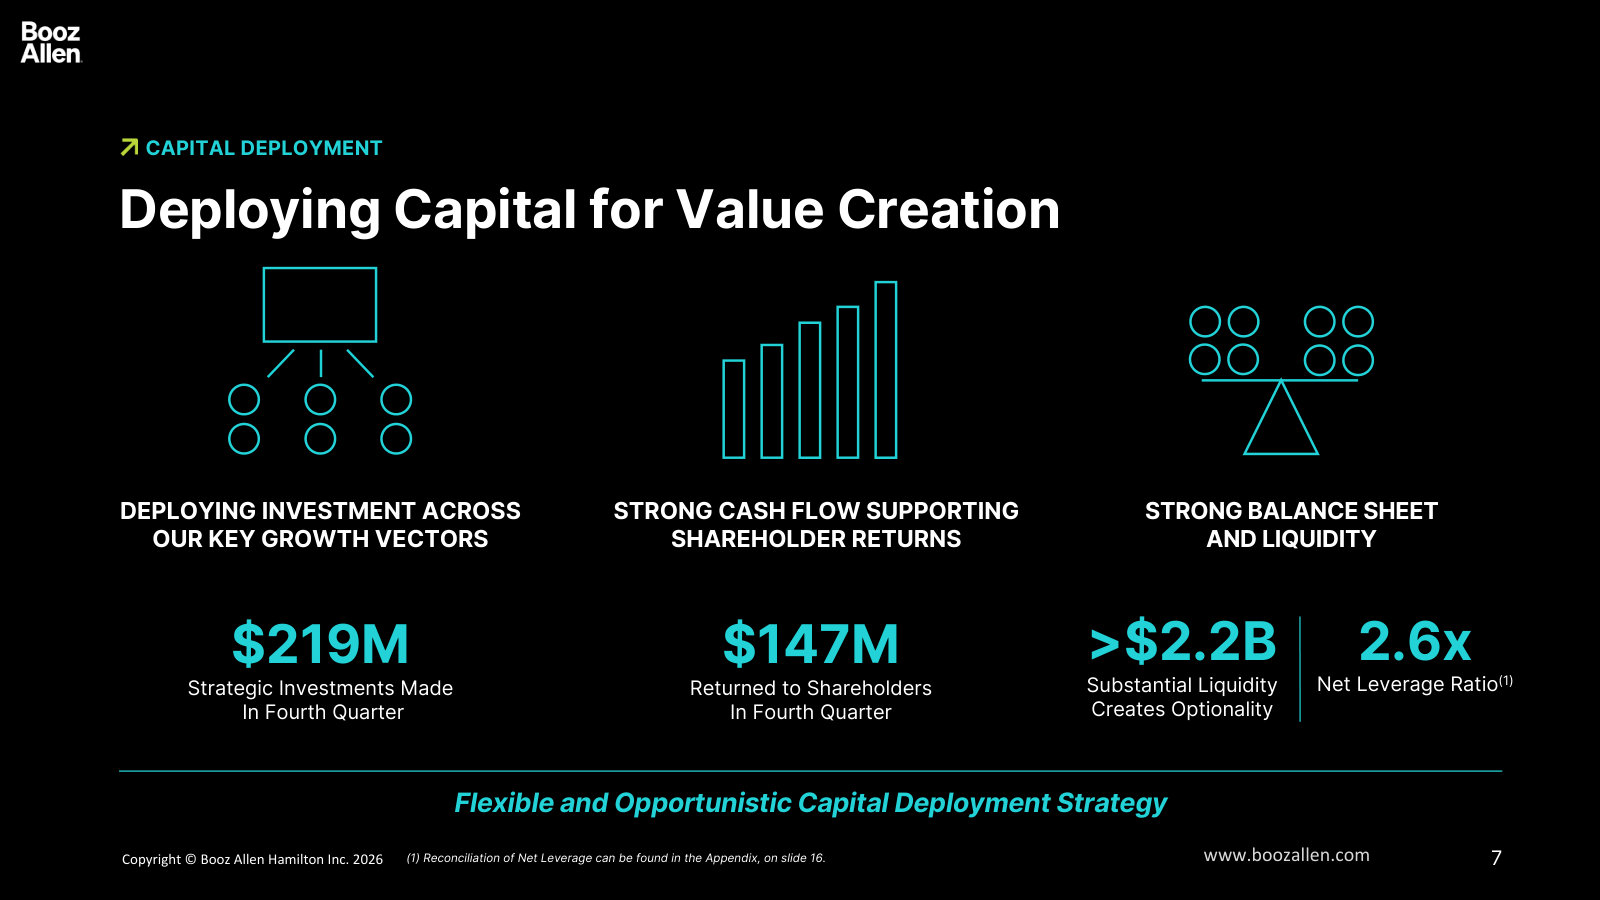
Q4 FY2026 Earnings Presentation — FY2026
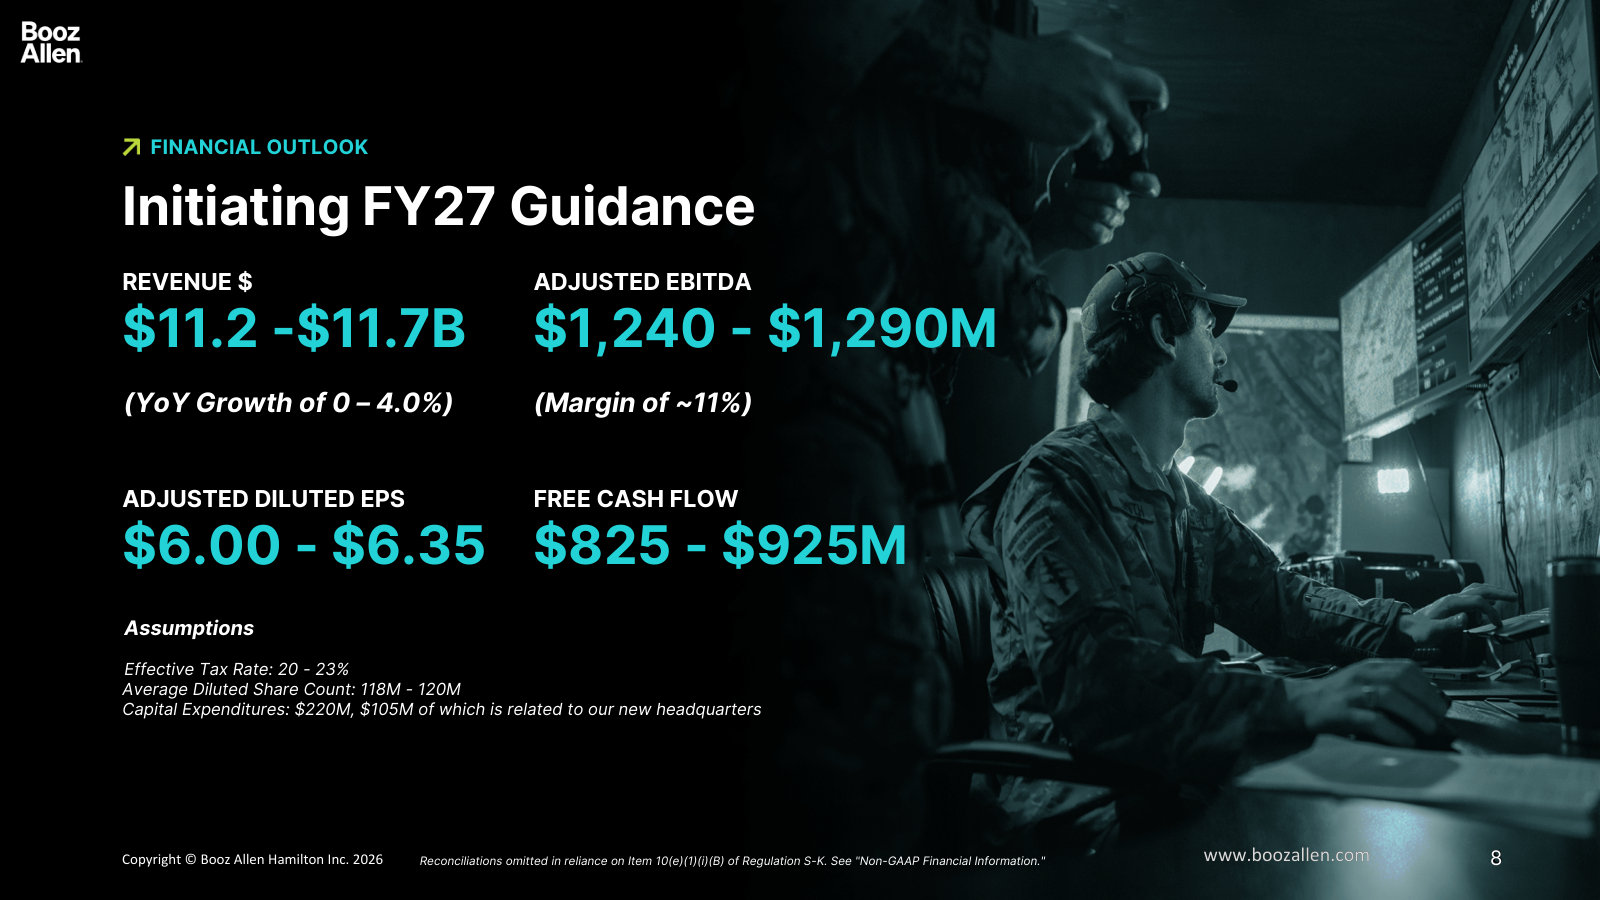
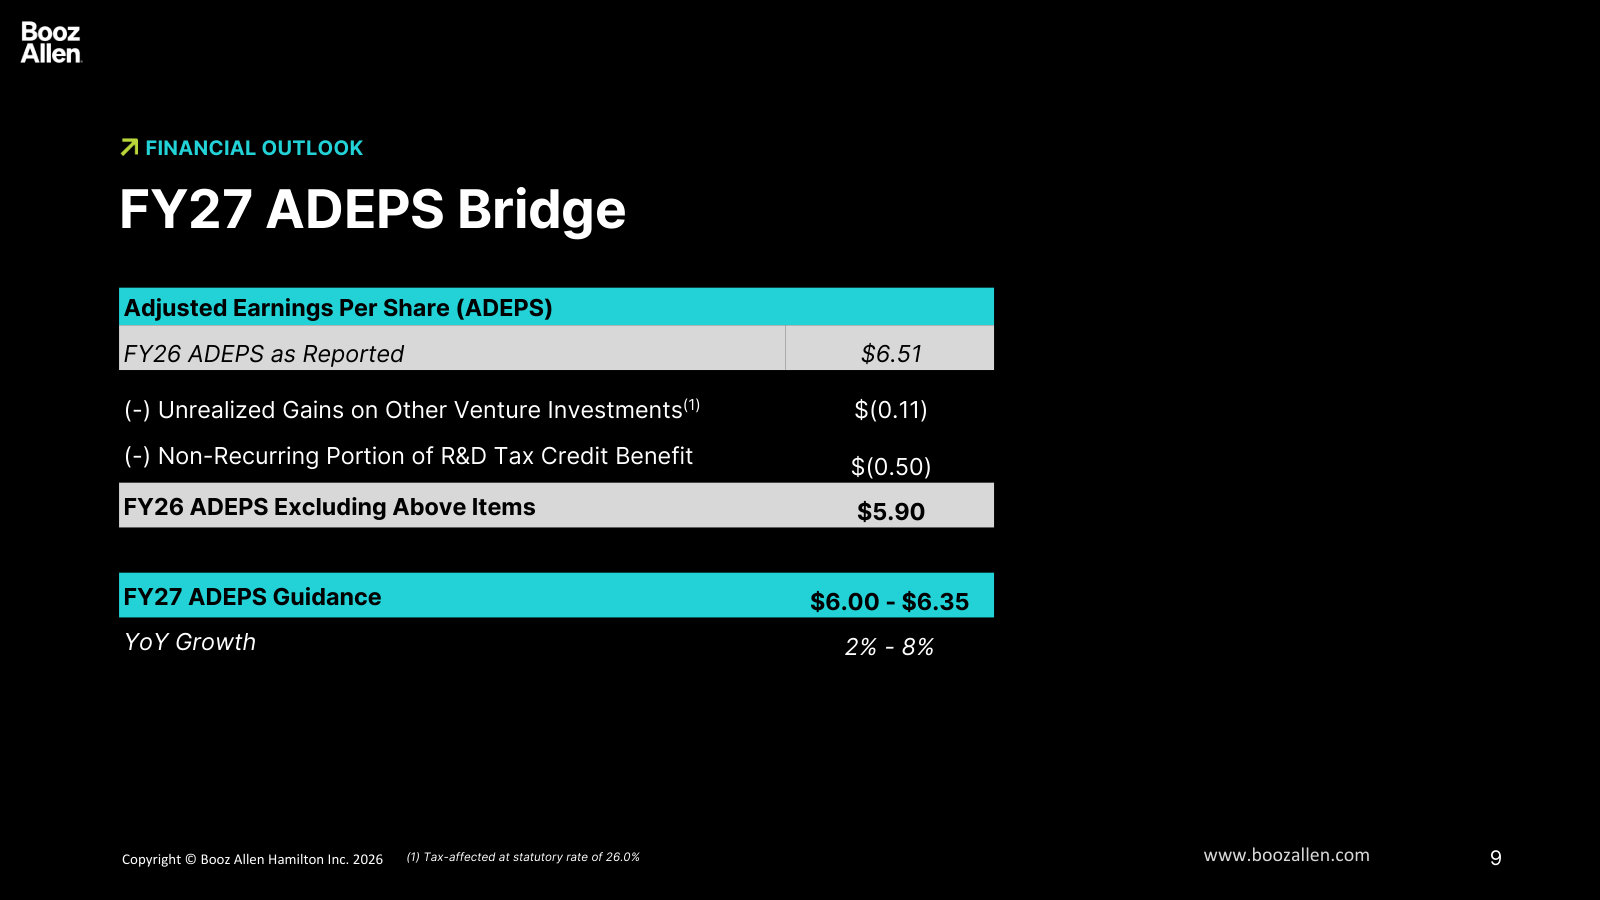
The most recent full-year deck: FY2026 results, capital deployment, and the initial FY2027 guidance management now works to. · Open the full document →
Q4 FY2025 Earnings Presentation — FY2025
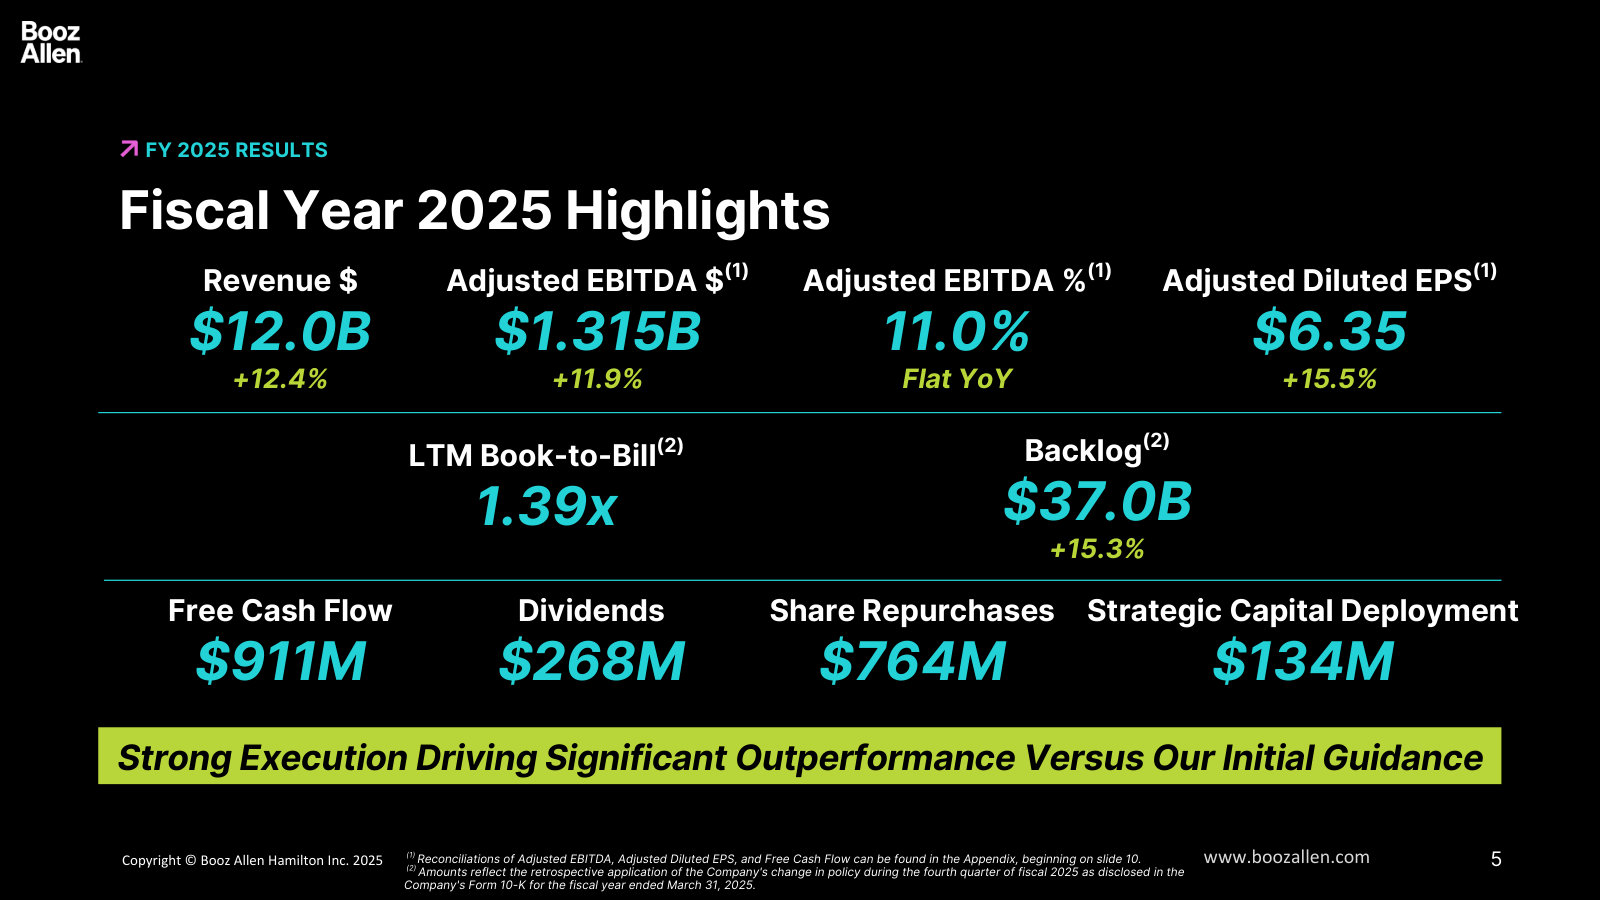
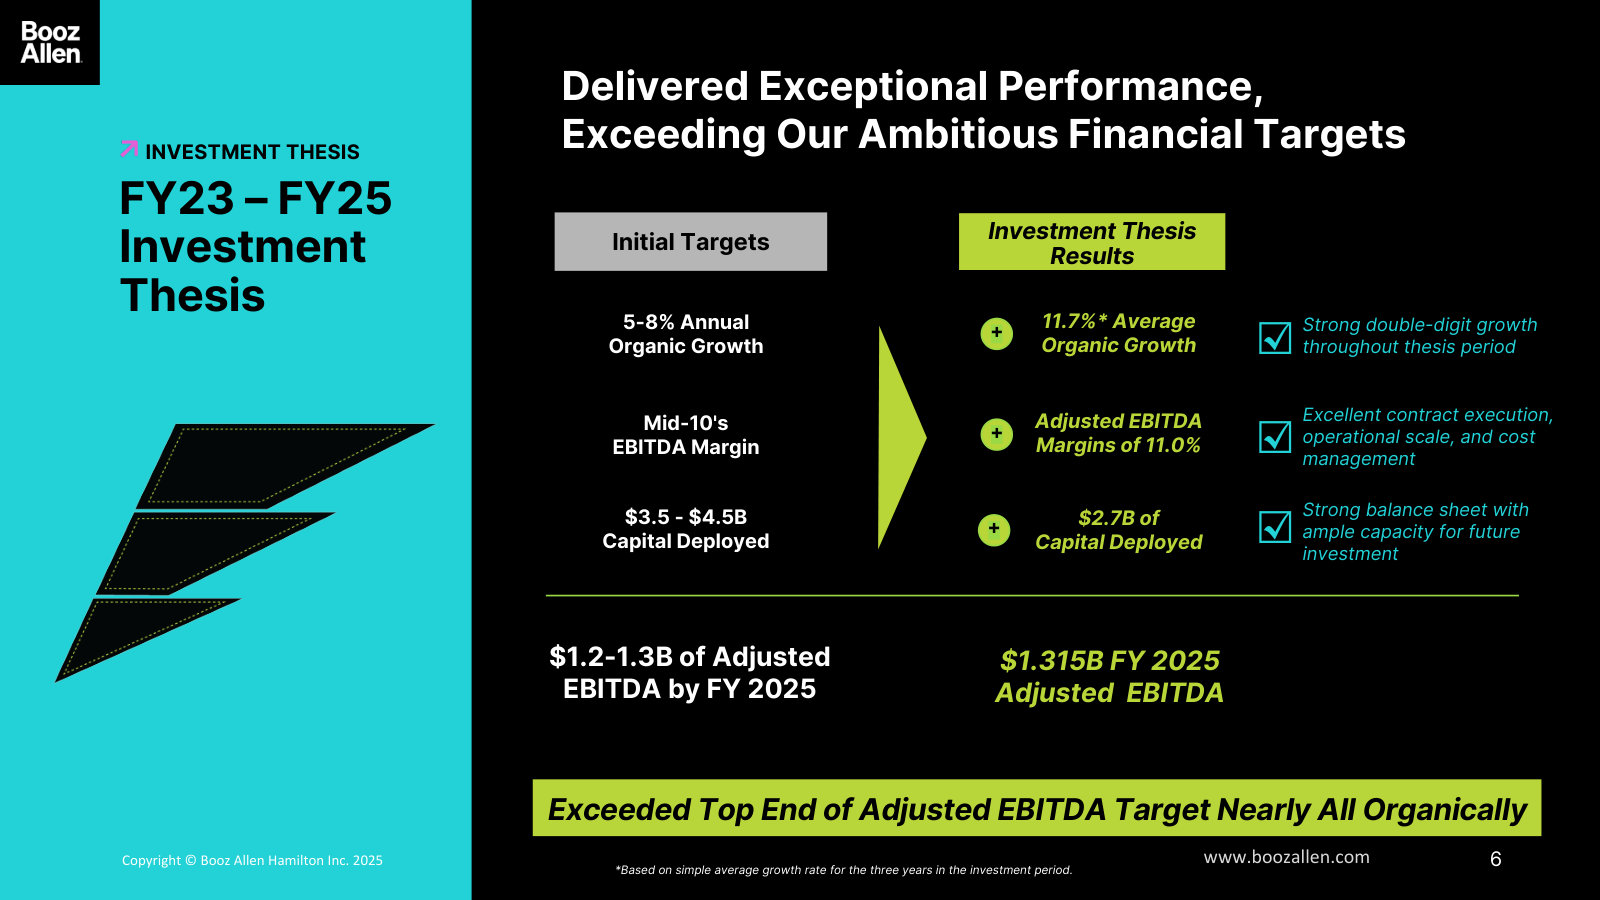
The FY2025 deck, notable for grading management's completed FY2023–2025 investment thesis against the targets it set. · Open the full document →
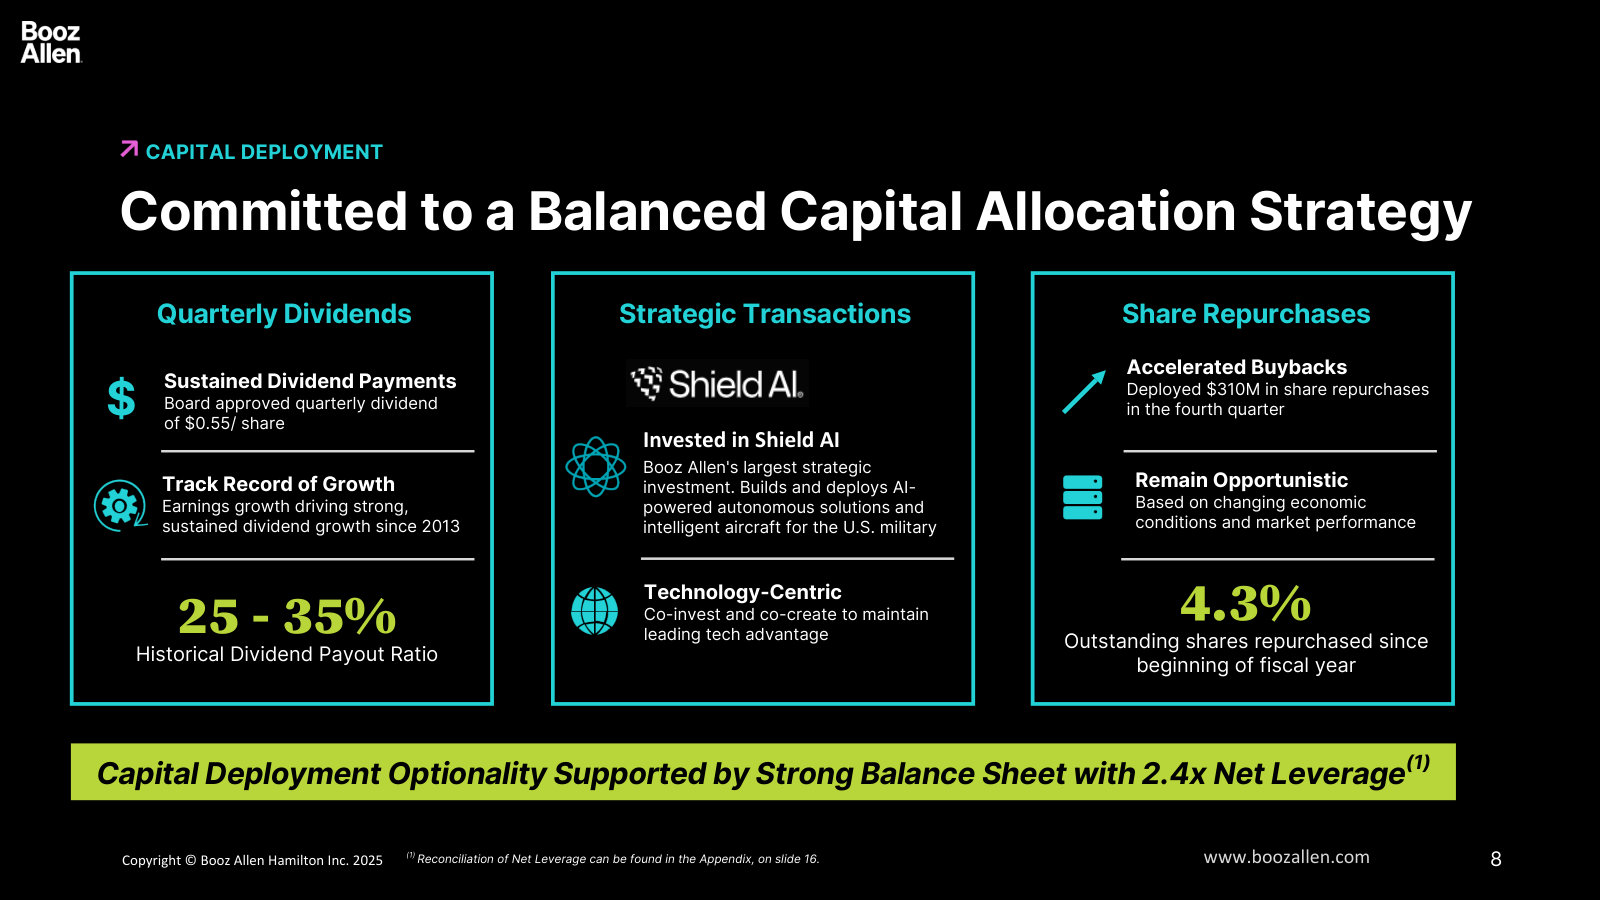
Q4 FY2024 Earnings Presentation — FY2024
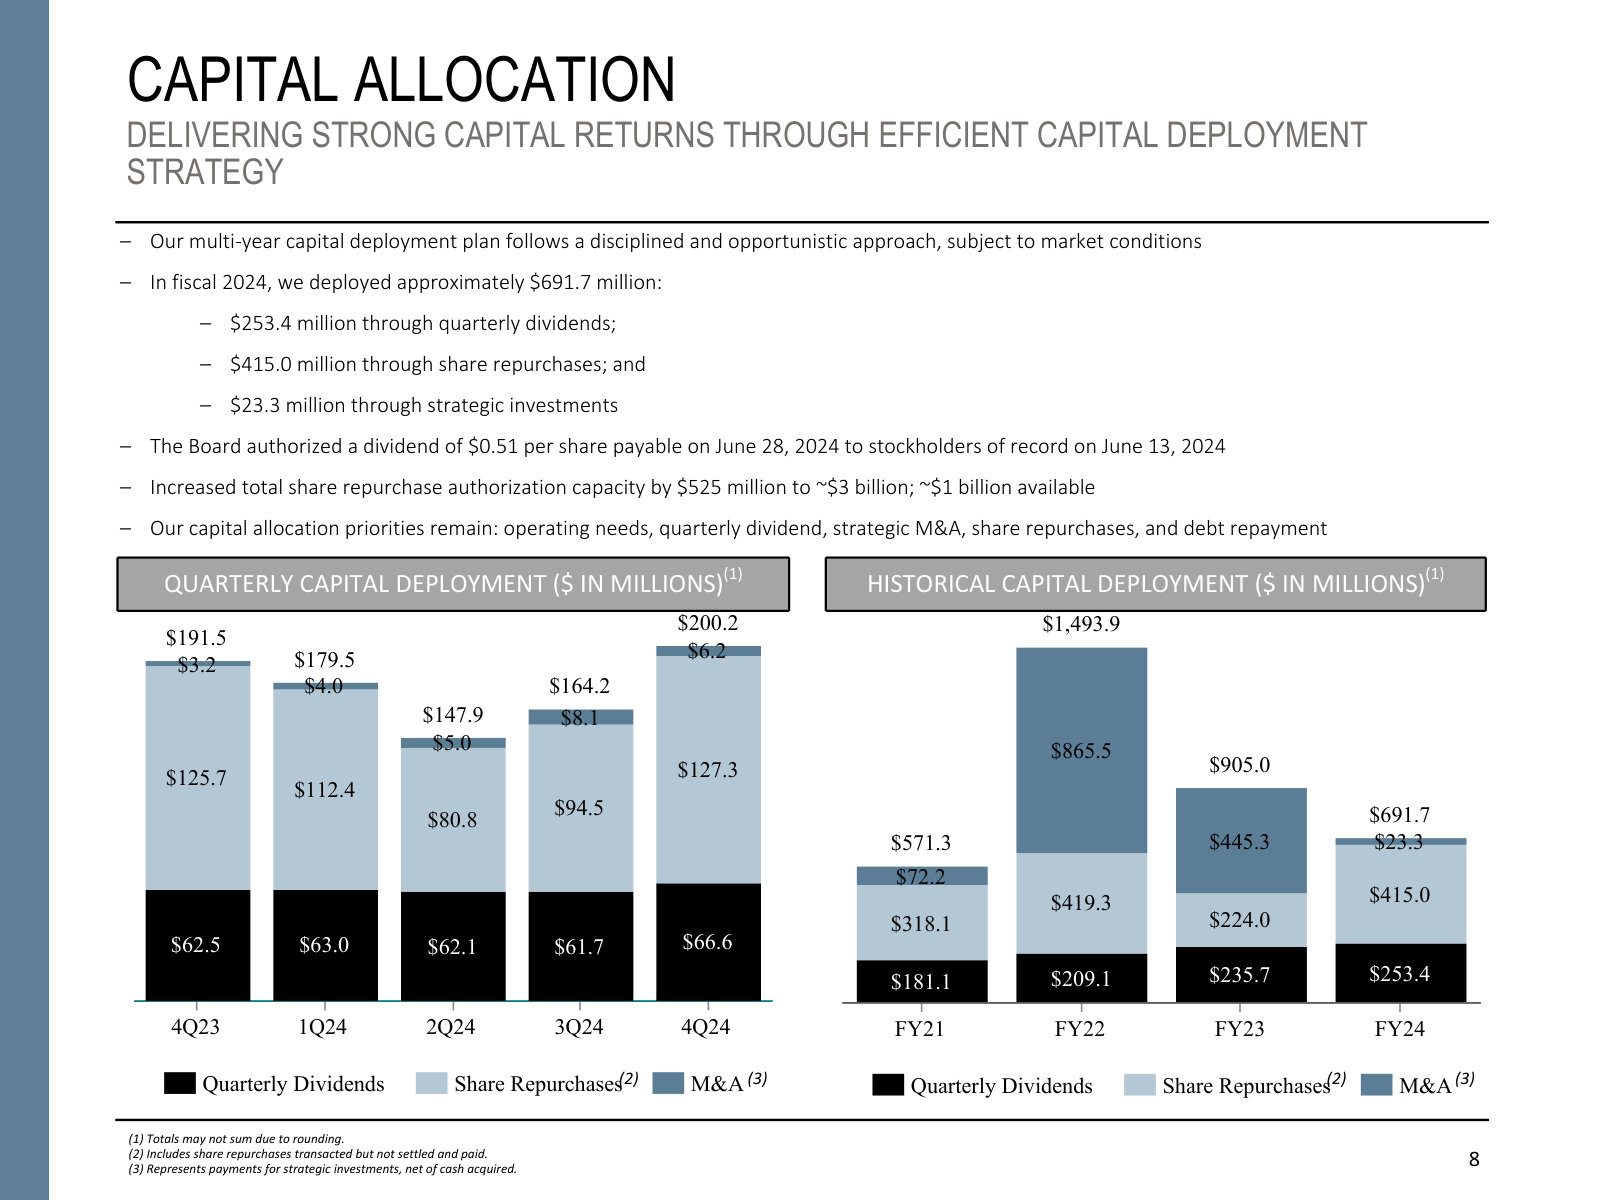
The FY2024 deck, in the older format that still carried the business-model charts — demand pipeline and capital history later decks dropped. · Open the full document →
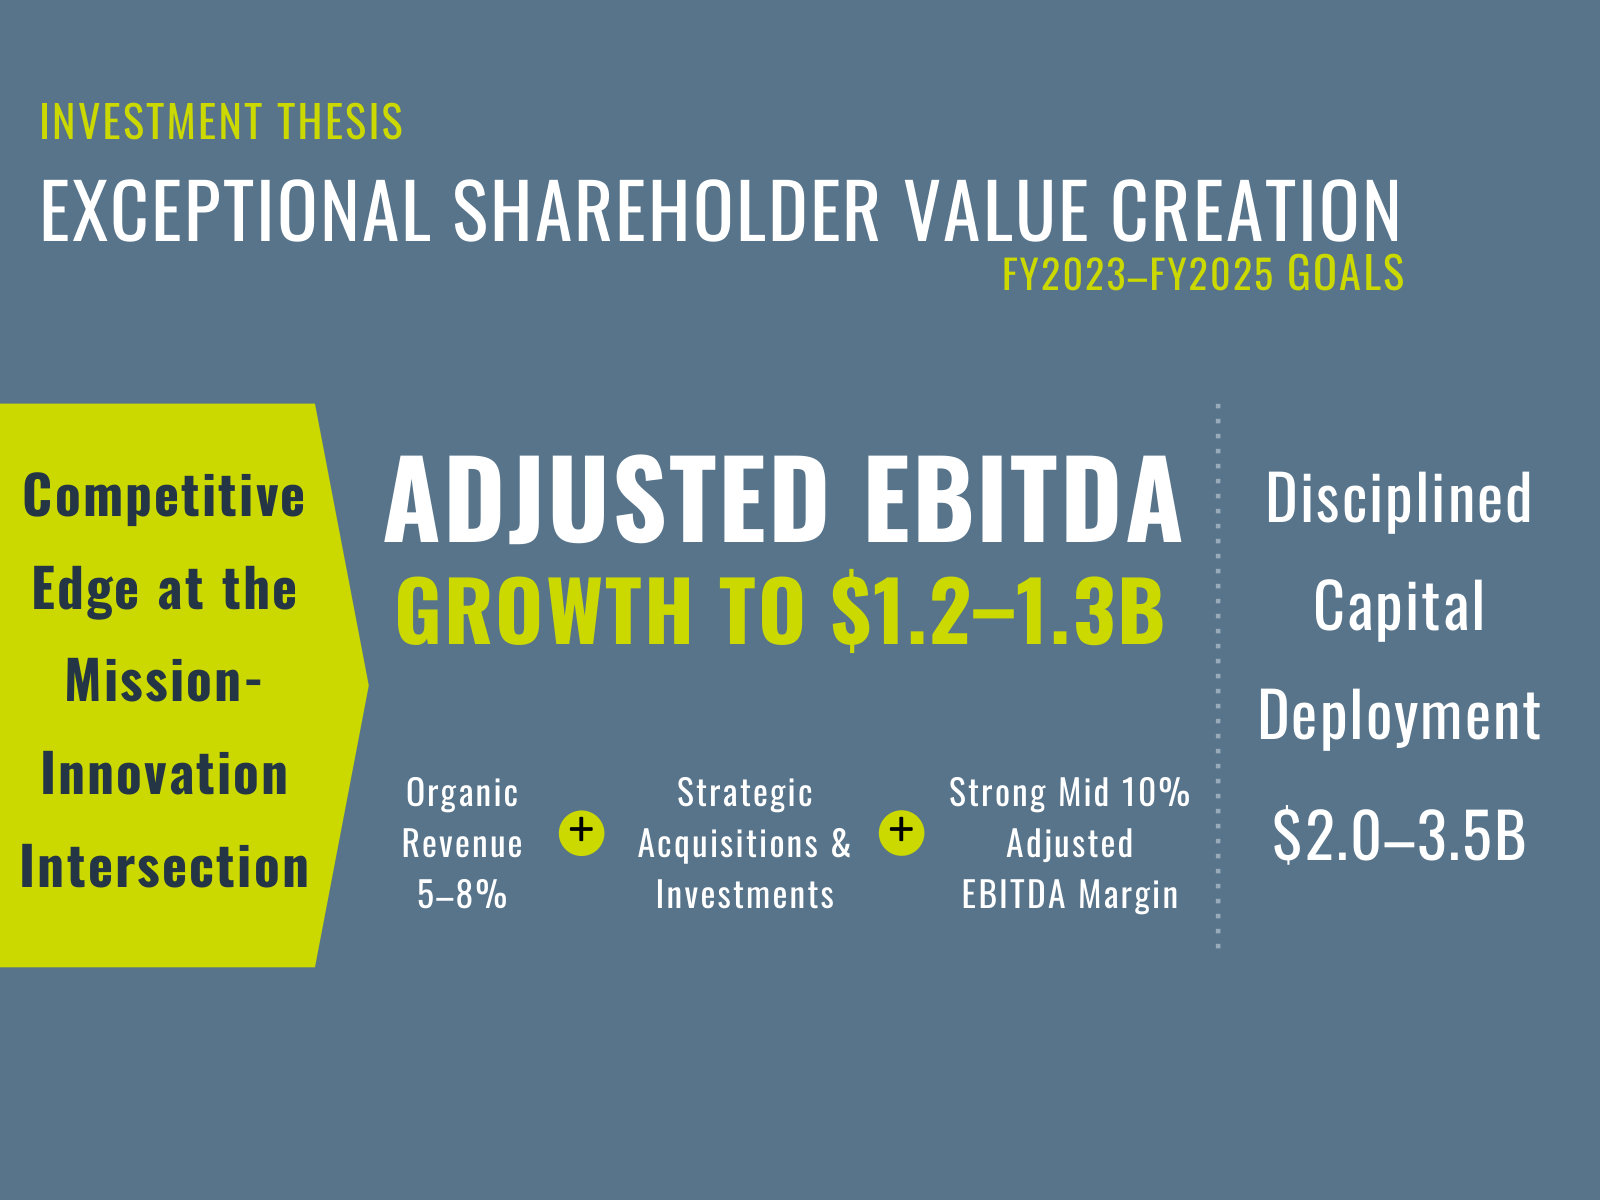
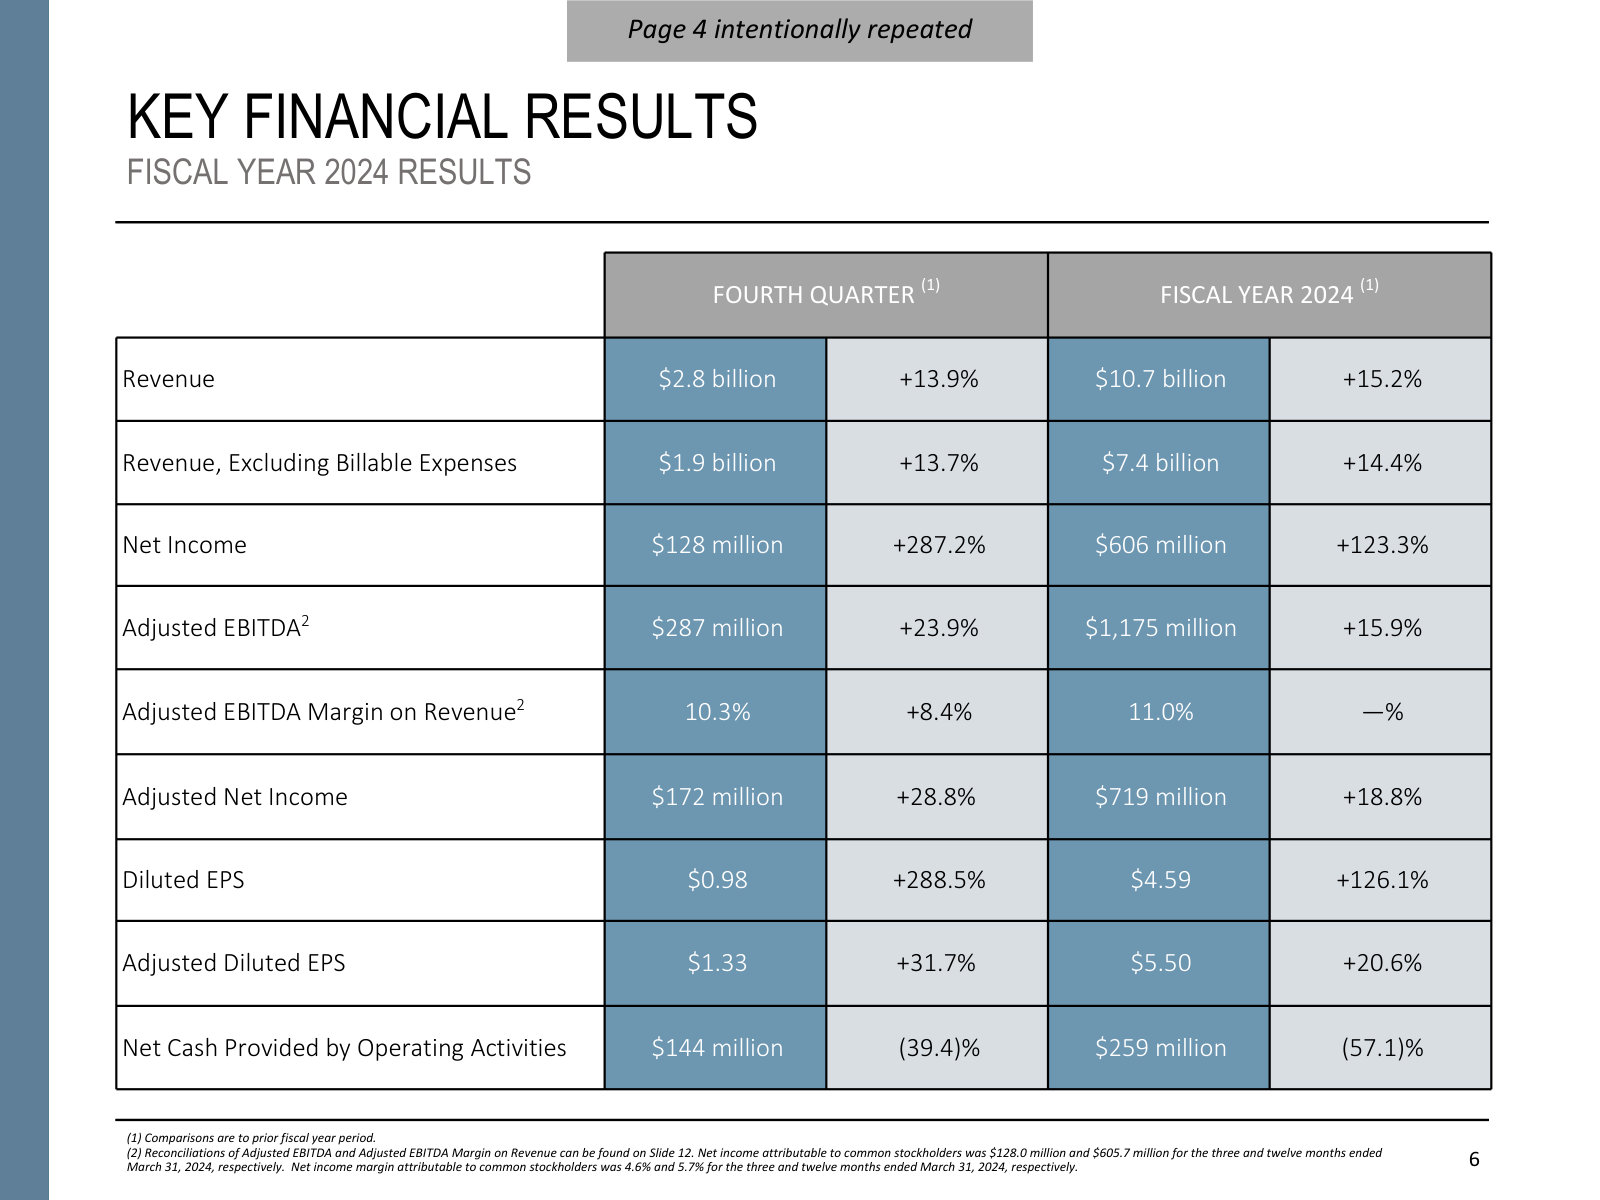
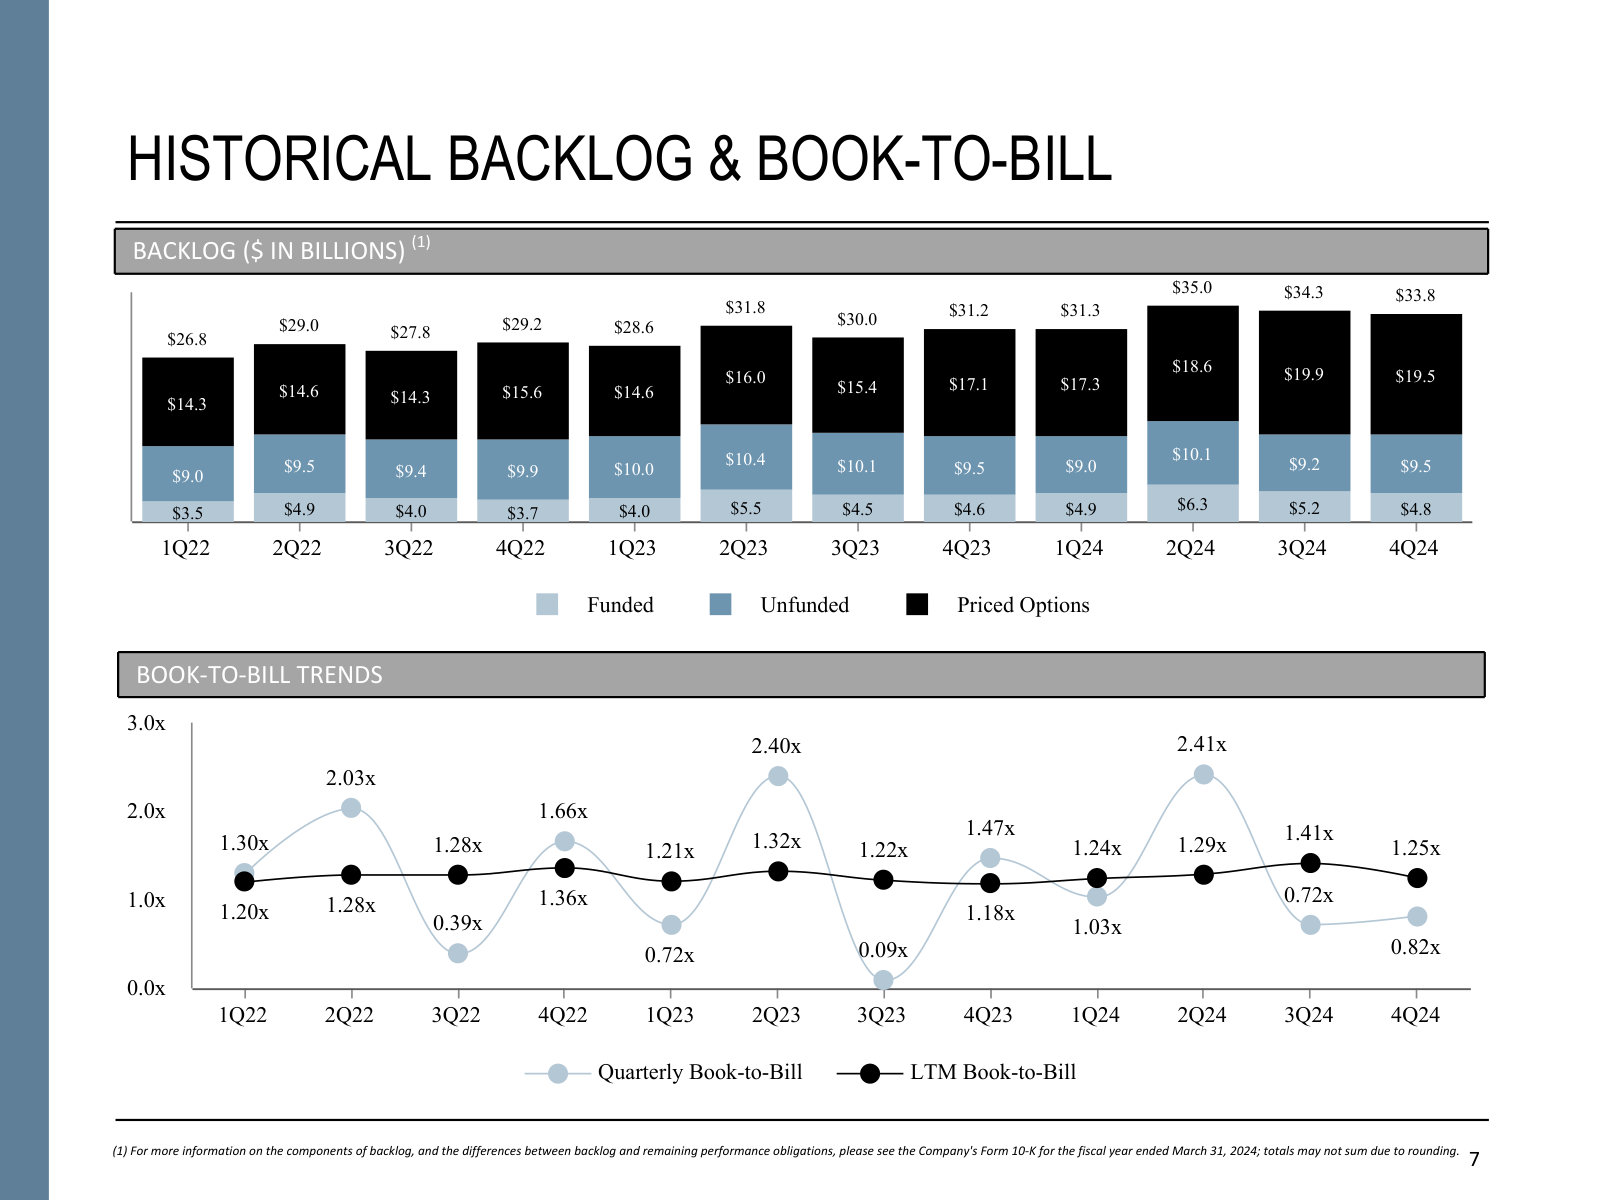
More from management
Q3 FY2026 Earnings Presentation — Q3 FY2026 · 17 pages · The interim quarter before the FY2026 annual deck, with a guidance-range crosswalk for the year. · Open →
Q2 FY2026 Earnings Presentation — Q2 FY2026 · 16 pages · Mid-year FY2026 update; same financial-summary format as the featured annual decks. · Open →
Q2 FY2025 Earnings Presentation — Q2 FY2025 · 17 pages · The quarter that revised FY2025 guidance and walked through three discrete items behind the change. · Open →
Booz Allen Hamilton Holding Corporation's management answers for the business every quarter. These are the exchanges that explain it best — verbatim, from the call transcripts preserved in Sources. Each link opens the full transcript at that page in a new tab.
Q4 FY2026 Earnings Call — Q4 FY2026
The clearest current-state picture: a bifurcated business with Civil still declining and National Security carrying growth, and the plainest account of how outcome-based work is meant to break revenue free of headcount. · Open the full transcript →
The transformation thesis in one answer: why productivity, fixed price and IP monetization should let revenue grow faster than headcount.
Horacio Rozanski (Chairman & CEO); question from Gavin Parsons (UBS): Over time, not only in FY '27, but over time, we expect to see productivity gains from some of the work that we've done, for example, around delayering, identifying our business, both on the infrastructure, but importantly, in the way we prosecute the market, the move to outcome-based and fixed price and the monetization of our IP. And so that is what's going to diverge the curves between headcount growth and revenue growth. And as I've said, I would expect that over time, you will see higher profit growth and revenue growth and higher revenue growth and headcount growth. […] on the OTA front, we've seen a 50% increase in wins year-over-year, but a 90% increase in the pipeline, which means that that trend is accelerating
p. 5 · Read in context →
Contract economics: on cost-plus work Booz Allen keeps only about 40% of the savings it takes out — the rest goes back to the customer.
Troy Lahr (EVP & CFO); question from Scott Mikus (Melius Research): We generally get to keep about 40% of the cost reductions given the nature of our contracts. Of the cost that we took out, we generally realized about one-third of it in fiscal year 2026.
p. 11 · Read in context →
Capital allocation priorities under an executive order on contractor payouts — dividend first, buybacks continue.
Troy Lahr (EVP & CFO); question from Scott Mikus (Melius Research): We maintain a capital deployment strategy that supports growth and drives shareholder returns. Our first priority is paying the dividend. We also have a very disciplined and strategic view of inorganic investments, especially around cyber and defense tech. […] But you will still see us do share repurchases. We will keep doing buybacks; you see that in the share guide. We have a very healthy balance sheet and a lot of financial flexibility.
p. 11 · Read in context →
Q4 FY2025 Earnings Call — Q4 FY2025
The reckoning: as government-efficiency cuts hit, management restructures the Civil business, cuts roughly 7% of staff, and resets the revenue algorithm investors had relied on. · Open the full transcript →
The reset quantified: two ~3% Civil revenue headwinds and an ~7% first-quarter staff reduction.
Matt Calderone (EVP & CFO): Since the beginning of April, we have seen a reduction in the run rate on five of our large civil technology projects that we believe will collectively create about a 3% headwind to firm-wide revenue for fiscal year 2026. […] The impact of the loss of previously disclosed recompete at the VA now represents an additional approximately 3% headwind to our consolidated top line for FY 2026. […] we anticipate approximately a 7% reduction in Booz Allen Hamilton Holding Corporation's staff in the first quarter. This is heavily concentrated in our civil business.
p. 4 · Read in context →
Asked how he knows the Civil damage is contained and not just the first shoe to drop, the CEO frames the two overlapping dynamics behind the reset.
Horacio Rozanski (Chairman & CEO); question from Gavin Parsons (UBS): Hey, Gavin. Thanks for the question. Let me try and frame the entirety of what we see and try and answer your question from that perspective. […] our civil business is going through what we hope will be a one-time reset where most of the reviews have been concluded very positively regarding our technology and our work. However, we're facing this deceleration at a time where procurements are still somewhat frozen. On the other side of the dynamic is continued strength in our defense business and growing strength in our intelligence business. […] Our approach has been to take significant restructuring in our civil business now so that we are positioned to grow and can invest across the portfolio.
p. 6 · Read in context →
The revenue algorithm decoded — 'headcount growth plus 3%' — and why Civil's more fixed-price mix breaks the old formula.
Matt Calderone (EVP & CFO); question from Sheila Kahyaoglu (Jefferies): Our business is changing, and there are three dynamics where the traditional algorithm may look a little different than what we've experienced in the past. First, we referenced in the prepared remarks, we're actually winning a lot of work. Our bookto-bill last quarter was 0.7 times, very much in line with historical averages, winning over two billion dollars in work particularly in our defense and intel spaces. We anticipate our book-to-bill this quarter will be in line, if not better than historic norms. The second factor is the move to outcome-based contracting, which we've advocated for years. Over time, you would expect that to be accretive to margins. Finally, the third factor is what you referenced, which is the traditional headcount math. We mentioned that most of our busines is not fixed price. Typically, the algorithm is headcount growth plus 3%. Since the reductions we are seeing are primarily in civil, which is more fixed price, the traditional formulas might not apply here as strictly.
p. 8 · Read in context →
Confronted directly on Booz Allen's bruised public image, the CEO on why it draws the scrutiny and how he answers it.
Horacio Rozanski (Chairman & CEO); question from Ronald Epstein (Bank of America): You know, I think a couple of things about this. First, when you are the market leader, you're the most interesting to write about, and we have the distinct pleasure of being written about frequently. We tend to be humble and relatively quiet about our communications; we've always wanted our customers to take credit for their wins because it's ultimately their decisions supported by our technology. […] Once people interact with the technology we've built, that speaks louder than any article. I believe our brand will be strengthened as a result of all this scrutiny.
p. 10 · Read in context →
Q3 FY2025 Earnings Call — Q3 FY2025
The first call under the new administration and DOGE — where management argues the VoLT strategy was built for exactly this stress test, months before the Civil cuts actually landed. · Open the full transcript →
Inside the talent engine: AI now reads 1,000+ resumes a night, letting the firm ramp staffing up and down far faster than before.
Horacio Rozanski (Chairman, CEO & President); question from Gautam Khanna (TD Cowen): We have gotten a lot faster in the way we can recruit and deploy. And so we can really compress the acceleration, deceleration process of our recruiting by a lot. For example, we are using artificial intelligence in different ways. So, now we get, call it, 1,000-plus resumes a day. They are read the same night in which the resumes come in and deployed against the potential opportunities out there. We didn’t have that capability two years ago.
p. 7 · Read in context →
Q4 FY2022 Earnings Call — Q4 FY2022
The blueprint every later call refers back to — the launch of the VoLT strategy and the three-year investment-thesis targets, in management's own words. · Open the full transcript →
The strategy defined: VoLT — velocity, leadership, technology — and the ambition to bring innovation faster than the pace of change.
Horacio Rozanski (President & CEO): At investor day, we introduced VoLT, our growth strategy. VoLT reflects our ambitions and guides us as we build the Booz Allen of the future. In our next era, we will scale Booz Allen to an even greater level of industry leadership.
We will be the premier partner to the federal government, continuously bringing innovation to national priority missions, faster than the pace of change. VoLT stands for velocity, leadership and technology. These three words are the fundamental principles for how we are transforming to achieve our aspirations.
p. 5 · Read in context →
The financial thesis in numbers: +50% adjusted EBITDA through FY2025, 5-8% organic growth, mid-10s margins, and billions in capital deployment.
Lloyd Howell (EVP, CFO & Treasurer): Before walking you through our results, I do want to frame the conversation in the context of our investment thesis, which is centered around growing adjusted EBITDA dollars by 50% through fiscal year 2025.
To achieve this objective, we define long-term financial targets at our investor day that will guide us. First, 5% to 8% annual organic revenue growth. Second, adjusted EBITDA margins stabilizing in the mid-10s. And lastly, deploying between $3.5 billion and $4.5 billion in capital.
p. 9 · Read in context →
A concrete proof point of the strategy: the $1.5bn eMAPS recompete, the largest single task order in company history.
Lloyd Howell (EVP, CFO & Treasurer): we had several notable wins in the fourth quarter, including our $1.5 billion eMAPS to recompete, the largest single task order in our company's history.
p. 10 · Read in context →
More calls
Q3 FY2026 Earnings Call — Q3 FY2026 · 12 pages · Go here for how the recovery is tracking mid-FY26: execution of the October cost-reduction program and how Booz Allen managed through the longest government shutdown in history. · Open →
Q2 FY2026 Earnings Call — Q2 FY2026 · 12 pages · The second downgrade — management pushes the Civil return-to-growth out by several quarters and launches a fresh cost-reduction program, with ~90% of bookings now in National Security. · Open →
Q1 FY2026 Earnings Call — Q1 FY2026 · 11 pages · The first quarter after the ~7% cut: how the Civil restructuring landed in the numbers and how procurement executive orders are reshaping demand. · Open →
Q2 FY2025 Earnings Call — Q2 FY2025 · 12 pages · The last pre-election call — the VoLT thesis at cruising altitude, useful as the baseline against which the post-transition disruption is measured. · Open →
Q4 FY2024 Earnings Call — Q4 FY2024 · 13 pages · The pre-shock annual: double-digit-growth-era results and the full-year guidance framework before government-efficiency cuts changed the story. · Open →
Q1 FY2025 Earnings Call — Q1 FY2025 · 10 pages · Peak growth-era momentum and management's early read on how a coming administration change might play out for federal IT spending. · Open →
Booz Allen Hamilton Holding Corporation's annual reports contain management's most considered account of the business. These are the sections, passages and visual pages worth opening in the originals preserved in Sources.
Booz Allen Hamilton — FY2026 Annual Report (Form 10-K) — FY2026 (year ended March 31, 2026)
Latest 10-K, and the one where the DOGE-era spending squeeze first hits: revenue fell 6% to $11.2B on a slowed-procurement, shutdown-hit federal market. · Open the full document →
Item 1. Business — Overview & Our Technology — p. 5 · Read the full section →
How Booz Allen frames itself today: an 'advanced technology company' for government, and the federal government's largest AI provider.
From 112-year consultancy to advanced-technology company for government.
Booz Allen Hamilton Holding Corporation (herein referred to as “Booz Allen,” the “Company,” “we,” “us,” or “our”) is an advanced technology company building products and solutions for government and business. For more than 112 years, Booz Allen has evolved to meet the needs of commercial, international, and government customers. […] In 2013, Booz Allen began another massive multi-year transformation by making significant investments in the emerging technologies that would help transform government. The Company rebuilt its workforce with technologists that bring deep mission expertise in national security and other core government missions. These investments propelled Booz Allen as a leader in artificial intelligence (“AI”), cyber, quantum, and other advanced technologies.
p. 5 · Read in context →
Positions itself as the federal government's largest AI provider, ~400 active AI projects.
As the federal government’s largest AI provider with approximately 400 active AI projects, we build secure AI solutions and advanced capabilities spanning agentic AI, physical AI, and AI-Radio Access Network (AI-RAN), and other emerging technologies designed for mission critical environments.
p. 7 · Read in context →
Item 1. Business — Our Customers — p. 9 · Read the full section →
The customer base is almost entirely the U.S. government across Defense, Intelligence and Civil; the VA alone is 10% of revenue.
Diverse public/private base, but Veterans Affairs is the single largest customer at 10% of revenue.
Booz Allen is committed to solving our customers’ toughest challenges, and we work with a diverse base of public and private sector customers across a number of industries in the U.S. and select foreign locations. […] Our civil government customers include many of the civil agencies of the U.S. government, of which the Department of Veterans Affairs was the single largest customer in fiscal 2026, from which we derived 10% of our revenue.
p. 9 · Read in context →
Item 1. Business — Contracts & Competition — p. 9 · Read the full section →
The revenue engine and its rivals: 84% of revenue rides on IDIQ task orders, competed against software, defense and services giants.
5,026 contracts; ~84% of revenue from IDIQ task orders, top vehicle ~17%.
We delivered solutions, outcomes, and services under 5,026 contracts and task orders in fiscal 2026 and approximately 84% of our revenue was derived from 2,426 active task orders under IDIQ contract vehicles. Our top IDIQ contract vehicle represented approximately 17% of our revenue in fiscal 2026.
p. 11 · Read in context →
Competes with enterprise software, global tech, defense primes, integrators and startups.
We operate in highly competitive markets, and we compete with companies of all types and sizes. Our major competitors include large enterprise software companies, large global technology providers, government contractors focused principally on the provision of technology services to the U.S. government, large defense contractors that provide both products and technology services to the U.S. government, diversified service providers, systems integrators, small businesses, and technology startups.
p. 11 · Read in context →
Item 1. Business — Our People and Culture — p. 11 · Read the full section →
The talent-and-clearance moat: ~31,500 people, ~77% holding security clearances — the barrier a competitor cannot buy.
~31,500 employees; ~77% hold security clearances, ~30% veterans.
As of March 31, 2026, we employed approximately 31,500 people across the U.S. and select global regions, including 28,800 customer staff. We work in 23 countries, with 32 major business centers and more than 20 engineering, manufacturing, and R&D facilities. […] Nearly 30% of our workforce identifies as veterans or individuals with military experience, and approximately 77% of our employees hold security clearances (based on voluntary selfreporting).
p. 11 · Read in context →
Item 1A. Risk Factors — p. 16 · Read the full section →
The two risks that actually bind Booz Allen: dependence on U.S. government spending, and the supply of clearance-eligible talent.
Demand risk: government spending levels and efficiency drives can cut revenue.
U.S. government spending levels and mission priorities could change in a manner that adversely affects our future revenue and limits our growth prospects. […] Our business depends upon continued U.S. government expenditures on defense, intelligence, and civil programs for which we provide support. These expenditures have not remained constant over time, have been and in the future may be reduced in certain periods, and have been and in the future may be affected by the U.S. government’s efforts to improve efficiency and reduce costs affecting U.S. government programs generally.
p. 19 · Read in context →
Supply risk: intense competition for scarce, clearance-eligible personnel.
Our business depends in large part upon our ability to attract and retain sufficient numbers of highly qualified individuals who may have advanced degrees and/or appropriate security clearances. We compete for such qualified personnel with other U.S. government contractors, the U.S. government, and private industry, and such competition is intense. Personnel with the requisite skills, qualifications, or security clearance may be in short supply or generally unavailable.
p. 30 · Read in context →
Item 7. MD&A — U.S. Political, Budget and Regulatory Environment — p. 67 · Read the full section →
Management's own account of the FY2026 headwind: efficiency reviews, contract cancellations and a slowed procurement pipeline.
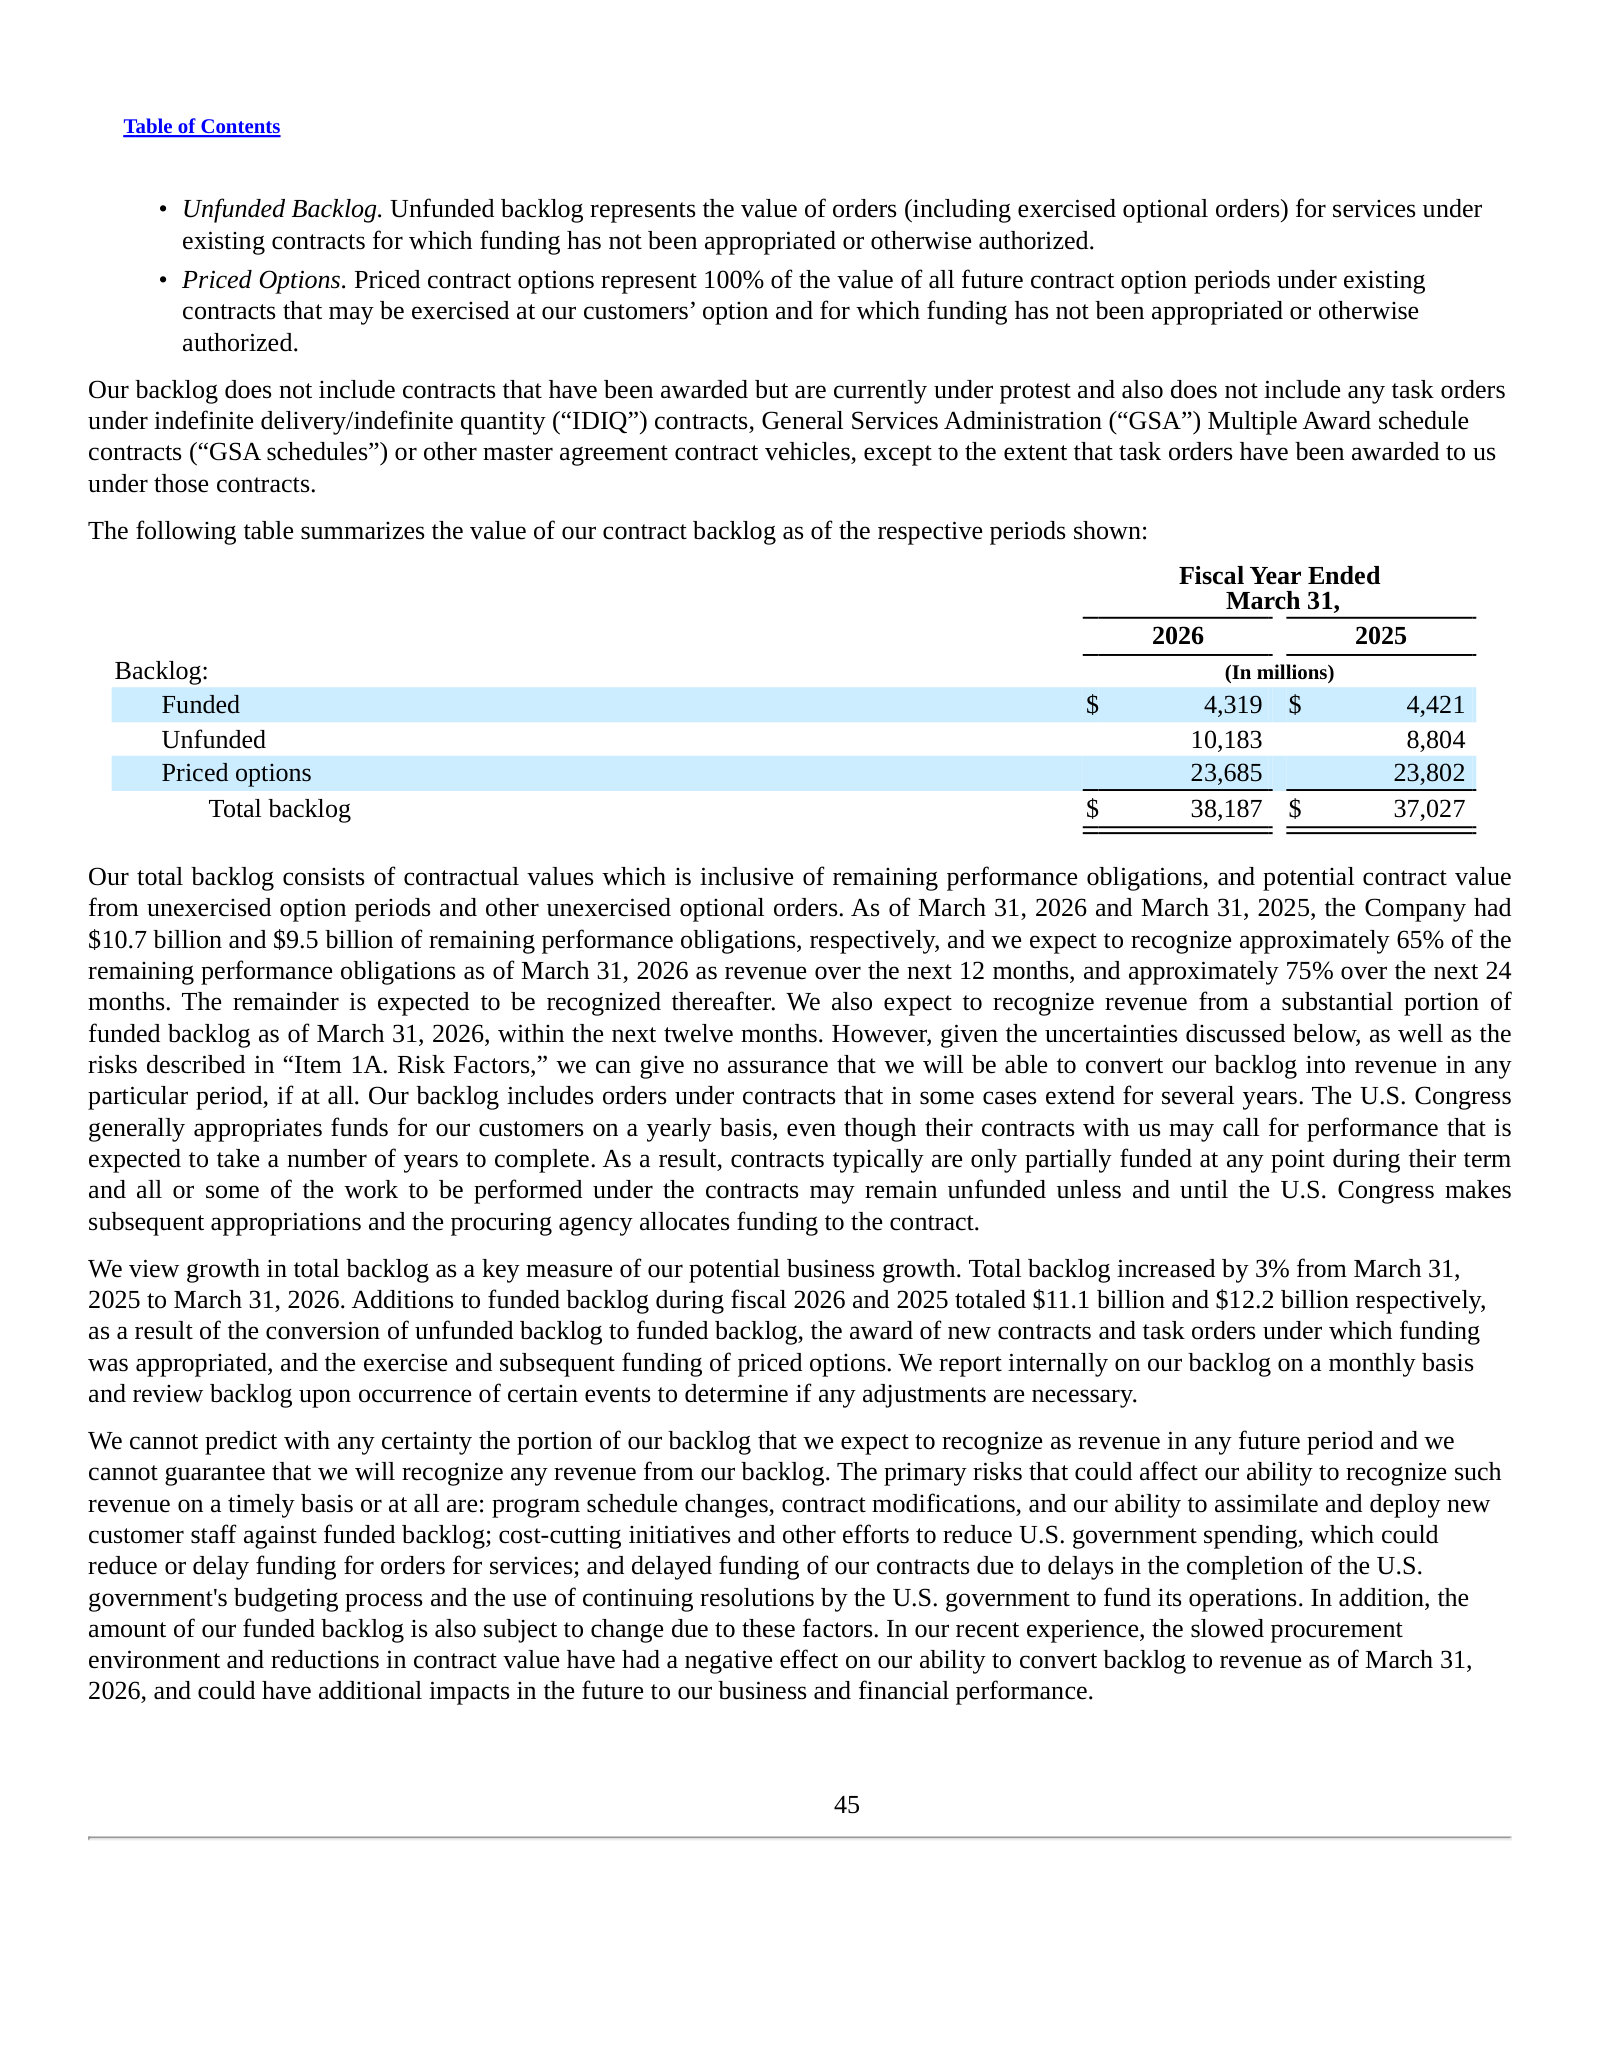
Item 7. MD&A — Contract Backlog — p. 69 · Read the full section →
Backlog is the forward book; it grew to $38B, but management warns the slowed environment is impairing conversion to revenue.
Item 7. MD&A — Results of Operations: Revenue — p. 76 · Read the full section →
The plainest statement of what drove the year: a 6% revenue decline tied to a shutdown and funding slowdown.
Revenue down 6% to $11.2B on slowed procurement and the Q3 government shutdown.
Revenue decreased 6% to $11,217 million, primarily driven by the impact of a slowed procurement and funding environment, including the government shutdown that occurred in the third quarter of fiscal 2026. These factors drove a decrease in headcount, as well as a decline in billable expenses.
p. 76 · Read in context →
Booz Allen Hamilton — FY2022 Annual Report (Form 10-K) — FY2022 (year ended March 31, 2022)
Included for one contrast: four years ago Booz Allen described itself as a management-consulting firm with technical capabilities — the opposite emphasis of the FY2026 'advanced technology company.' · Open the full document →
Item 1. Business — Overview — p. 7 · Read the full section →
The pre-repositioning self-description: 'deep expertise in management consulting' comes first, technology second.
FY2022 framing: blends management-consulting expertise with advanced technical capabilities.
Building on our legacy of passionate client service and guided by our long-term growth strategy, we blend deep expertise in management consulting with advanced technical capabilities to deliver powerful solutions.
p. 7 · Read in context →
More annual reports
Booz Allen Hamilton — FY2025 Annual Report (Form 10-K) — FY2025 · 119 pages · The peak year before the squeeze: revenue $11.98B; useful baseline against the FY2026 decline. · Open →
Booz Allen Hamilton — FY2024 Annual Report (Form 10-K) — FY2024 · 142 pages · Revenue $10.66B; first year presenting the VoLT strategy narrative. · Open →
Booz Allen Hamilton — FY2023 Annual Report (Form 10-K) — FY2023 · 145 pages · Transition-year 10-K bridging the consulting-era framing to the technology repositioning. · Open →
Competitors describe Booz Allen Hamilton Holding Corporation's market in their own filings and calls. These verified passages and visual pages show where their strategies meet, using source documents preserved in Sources.
Leidos Holdings, Inc. (LDOS)
The largest US federal IT and technical-services contractor; competes with Booz Allen across national-security digital, cyber and AI-enabled mission work, and names Booz Allen as a principal competitor.
Leidos's 10-K lists Booz Allen among its principal competitors and flags AI and Federal Acquisition Regulation reform as widening the field.
Our principal competitors currently include the following companies: Accenture Federal Services LLC, Amentum Services Inc., KBR, Inc., BAE Systems, Booz Allen Hamilton Inc., CACI International Inc., Deloitte, General Dynamics Corporation, GovCIO, IBM, KBR Inc., L3Harris Technologies, Inc., Lockheed Martin Corporation, ManTech, Northrop Grumman Corporation, Optum, Parsons Corporation, Peraton Inc., RTX Corporation and SAIC. […] Technological advances, including artificial intelligence, autonomy and robotics, changing customer requirements, as well as the ongoing significant reform of the Federal Acquisition Regulation ("FAR") are enabling expanded competition from both traditional and nontraditional competitors.
p. 15 · Read in context →
CEO sizes the intelligence-community budget trajectory and frames AI as a tailwind, not a threat, in the digital/mission market Booz Allen also serves.
Tom Bell — Chief Executive Officer: the intelligence community budgets have grown 4% to 5% annually since 2022, and we see that continuing. In the classified budgets, you see a lot of money going into the digital infrastructure part of the ecosystem for defense and intelligence. That's why AI isn't a disruptor for us, it's a propellant to our progress in this business.
p. 10 · Read in context →
CEO details how DOGE-driven government cost-cutting shows up operationally — stop-work orders, terminations and pricing reviews — across the federal-services market.
Thomas A. Bell — Chief Executive Officer: we have been closely monitoring all disruptions related to DOGE and DOGE-related contracts over the past six months. This includes stop work orders, terminations, descopes, and what we refer to as DOGE-inspired pricing reviews.
p. 12 · Read in context →
CACI International Inc (CACI)
A core defense and intelligence technology provider overlapping Booz Allen in cyber, mission IT and analytics for national-security customers.
CACI's 10-K characterises its market as fragmented with no dominant player, and states an intent to gain share both organically and through acquisitions — the same addressable pool Booz Allen pursues.
We know of no single competitor that is dominant in our fields of technology. We have a relatively small share of the addressable market for our Expertise and Technology and intend to achieve growth and increase market share both organically and through strategic acquisitions.
p. 7 · Read in context →
CEO says GSA/DOGE efficiency actions hit the federal-civilian market hard but not CACI, which deliberately pivoted its portfolio toward defense and intelligence in 2019 — a pointed contrast with peers still exposed to civilian budgets.
John S. Mengucci — President and Chief Executive Officer: I think you've seen a lot of the cost efficiency, those GSA actions really hitting the federal civilian area hard. But as the CEO of a publicly traded company who moved away from that market a number of years back, it really doesn't have any impact.
p. 9 · Read in context →
CEO on competitor behaviour under budget pressure, implying rivals are turning more price-aggressive, with a rise in contract protests.
John Mengucci — President and Chief Executive Officer: if we've ever lost on price, it's not because we're in a price shootout because we gave up that part of the ecosystem about 7 to 8 years back. But I would imagine people are going to do whatever they need to do to continue to win business. I mean, we've seen a little uptick in the number of protests, which are out there.
p. 10 · Read in context →
Science Applications International Corporation (SAIC)
A pure-play technology-services provider to the US government; among Booz Allen's closest business-model peers in systems integration, digital engineering and mission IT.
CFO argues undifferentiated, labour-based government services are the most exposed to recompetes and efficiency pressure — a lens on where staff-heavy federal work is vulnerable.
Prabu Natarajan — Chief Financial Officer: there are parts of the market where you're focused on pure labor-based services, without differentiation, in sort of either enterprise IT or mission IT that is hard to differentiate you are vulnerable for recompetes. […] I think it would be a crisis that's wasted by industry if we don't step up and change the way we go to market.
p. 6 · Read in context →
CFO on commercial and non-traditional entrants pushing into government work, and why 'mission integration' is the moat incumbents such as SAIC and Booz Allen rely on.
Prabu Natarajan — Chief Financial Officer: Clearly, there we are seeing new entrants in the market, nontraditional, with more commercial orientation to them. […] I think we believe sincerely that the offerings from commercial vendors still will require mission integration at its core to be able to operate inside of the government environment. So we welcome the competition in the industrial base.
p. 4 · Read in context →
SAIC's 10-K describes a government-services market where competition has intensified, sole-source awards are fewer and price and affordability increasingly decide awards.
Competition within the government services industry has intensified, which has led to fewer sole-source awards and an increased emphasis on cost competitiveness and affordability.
p. 14 · Read in context →
Parsons Corporation (PSN)
Its Federal Solutions segment competes with Booz Allen across cyber, intelligence, missile defence and space; Parsons names Booz Allen first in its federal peer group.
Parsons' 10-K names Booz Allen first in its Federal Solutions peer group of US federal systems integrators.
Our peer group in Federal Solutions are U.S. federal systems integrators and service providers such as Booz Allen Hamilton, CACI International Inc, Leidos Holdings, Inc., and Science Applications International Corporation.
p. 24 · Read in context →
Parsons reports its contract win rates, including a 99.6% re-compete win rate in fiscal 2025 — a benchmark for incumbent retention on federal work.
We achieved an overall win rate of 61% in fiscal 2025 […] which includes strong re-compete win rates of 99.6% in fiscal 2025 giving us long-term certainty on key contracts.
p. 8 · Read in context →
Parsons' Federal Solutions capability list overlaps Booz Allen's national-security portfolio across cyber, intelligence, missile defence, electronic warfare and space.
We provide critical technologies, including cyber; integrated air and missile defense; intelligence; aviation modernization; electronic warfare; space ground systems, cislunar, A-PNT, and classified sensors; geospatial intelligence; signals intelligence; environmental remediation; border security and counter-drug, critical infrastructure protection; counter unmanned air systems; biometrics; and bio surveillance.
p. 6 · Read in context →
ICF International, Inc. (ICFI)
A federal and commercial consulting firm competing with Booz Allen on civilian-agency advisory, digital and AI work; ICF names Booz Allen as a principal competitor.
ICF's 10-K lists Booz Allen Hamilton among its principal competitors in the federal-consulting market.
Some of our principal competitors include: Abt Global; Accenture; AECOM Technology Corporation; Booz Allen Hamilton Holding Corporation; CACI International Inc.; CLEAResult; Deloitte LLP; General Dynamics, Inc.; Guidehouse; Leidos Holdings, Inc.; PA Consulting Group; Science Applications International Corporation; Research Triangle Institute, International; Tetra Tech Inc.; and Westat, Inc.
p. 18 · Read in context →
CEO quantifies the federal-demand contraction ICF absorbed as the administration cut spending — a read on the civilian-agency exposure Booz Allen also carries.
John Wasson — Chief Executive Officer: our revenues from federal government clients, which declined 9.8% sequentially, representing a 25.2% reduction from last year's second quarter.
p. 2 · Read in context →
Maximus, Inc. (MMS)
A government health and citizen-services provider overlapping Booz Allen on federal digital modernization and AI-enabled services; Maximus names Booz Allen as a federal competitor.
Maximus's 10-K names Booz Allen among its primary US Federal Services competitors.
Our primary competitors in the U.S. Federal Services Segment are General Dynamics Information Technology, Deloitte, Leidos, IBM, Accenture, Booz Allen Hamilton, and other federal contractors.
p. 11 · Read in context →
CEO positions Maximus's AI 'Total Experience Management' platform for a multibillion-dollar government market — the AI-for-government demand Booz Allen also targets.
Bruce L. Caswell — President and Chief Executive Officer: one representative of a federal agency acknowledged TXM as the most sophisticated deployment of AI in a contact center environment that they had seen to date. We continue to invest in TXM as we address this multibillion-dollar government market.
p. 4 · Read in context →
More peer documents
CACI Q3 FY2026 earnings call — Q3 FY2026 · 13 pages · CEO refreshes the total addressable market (~$300bn vs CACI's ~$10bn) and flags electronic warfare and counter-UAS as growth areas. · Open →
Leidos Q3 FY2025 earnings call — Q3 FY2025 · 11 pages · Golden Dome SHIELD IDIQ and a large near-term pipeline, plus resilience through DOGE disruption and the government shutdown. · Open →
Parsons Q4 FY2025 earnings call — Q4 FY2025 · 15 pages · CEO sizes an ~$85bn reconciliation-driven addressable market and describes the IT-services 'dichotomy', naming CACI and Leidos. · Open →
Parsons Q1 FY2026 earnings call — Q1 FY2026 · 14 pages · Defense-budget sizing ($1.5tn FY2027 request) and Parsons' playbook for operating under a full-year continuing resolution. · Open →
SAIC Q4 FY2026 earnings call — Q4 FY2026 · 12 pages · CFO names the enterprise-IT recompetes SAIC lost (NASA Aegis, Cloud One, CENTCOM) where cost-plus work is hard to differentiate. · Open →
Maximus Q4 FY2025 earnings call — Q4 FY2025 · 11 pages · CEO sizes the defense services/software TAM and Maximus's targeted push into national-security and cyber — Booz Allen's core turf. · Open →
Maximus Q3 FY2025 earnings call — Q3 FY2025 · 12 pages · Scale claim (~60% of national Medicaid enrollment) and how DOGE staff are shifting toward modernization and contract consolidation. · Open →
ICF Q3 FY2025 earnings call — Q3 FY2025 · 11 pages · CEO attributes Department of Energy contract cancellations to DOGE and GSA actions — granular colour on civilian-agency funding cuts. · Open →
Source: S&P Capital IQ consensus via Xpressfeed · Generated 2026-07-24.
Five straight revenue misses, but EPS beat 30%+ in the last two prints
Revenue has come in below consensus every quarter since FY2025 Q4, the misses widening to the mid-single-digit range. Normalized EPS, by contrast, surprised +37% and +31% in the two most recent quarters — the earnings line is holding up far better than the revenue line.
Current sequences by metric: Revenue: 5 consecutive misses; EPS (normalized): 2 consecutive beats.
Currency: USD · Scale: money in millions, absolute · Consensus is captured before each actual first became effective.
| Quarter | Metric | Consensus | Actual | Surprise | Outcome |
|---|---|---|---|---|---|
| Q4 FY2026 | Revenue | $2.87bn | $2.78bn | -2.9% | Miss |
| Q4 FY2026 | EPS (normalized) | $1.36 | $1.78 | +30.7% | Beat |
| Q3 FY2026 | Revenue | $2.75bn | $2.62bn | -4.7% | Miss |
| Q3 FY2026 | EPS (normalized) | $1.29 | $1.77 | +37.1% | Beat |
| Q2 FY2026 | Revenue | $2.99bn | $2.89bn | -3.3% | Miss |
| Q2 FY2026 | EPS (normalized) | $1.51 | $1.49 | -1.5% | Miss |
| Q1 FY2026 | Revenue | $2.95bn | $2.92bn | -0.8% | Miss |
| Q1 FY2026 | EPS (normalized) | $1.45 | $1.48 | +2.2% | Beat |
| Q4 FY2025 | Revenue | $3.03bn | $2.97bn | -1.9% | Miss |
| Q4 FY2025 | EPS (normalized) | $1.61 | $1.61 | -0.3% | Miss |
| Q3 FY2025 | Revenue | $2.87bn | $2.92bn | +1.8% | Beat |
| Q3 FY2025 | EPS (normalized) | $1.52 | $1.55 | +1.9% | Beat |
| Q2 FY2025 | Revenue | $2.97bn | $3.15bn | +6.1% | Beat |
| Q2 FY2025 | EPS (normalized) | $1.49 | $1.81 | +21.7% | Beat |
| Q1 FY2025 | Revenue | $2.93bn | $2.94bn | +0.6% | Beat |
| Q1 FY2025 | EPS (normalized) | $1.52 | $1.38 | -9.2% | Miss |
FY2028 revenue and EPS both cut about 2% over the past 90 days
FY2027 estimates are roughly stable over 90 days, but FY2028 revenue and normalized EPS were each cut about 2%. The recent direction of travel is down, consistent with the run of top-line misses.
Currency: USD · Scale: money in millions, absolute · Point-in-time consensus; Δ90d is Now versus 90d.
| Metric | FY | 180d | 90d | 30d | Now | Δ90d |
|---|---|---|---|---|---|---|
| Revenue | FY2027 | $11.58bn | $11.50bn | $11.40bn | $11.42bn | -0.8% |
| Revenue | FY2028 | $12.21bn | $12.10bn | $11.98bn | $11.86bn | -1.9% |
| EPS (normalized) | FY2027 | $6.10 | $6.28 | $6.25 | $6.26 | -0.3% |
| EPS (normalized) | FY2028 | $6.77 | $6.97 | $6.87 | $6.81 | -2.3% |
Consensus models an FY2027 EPS dip, then double-digit growth as revenue reaccelerates
Normalized EPS is expected to fall below the FY2026 actual in FY2027 before compounding, while revenue growth builds from low-single to roughly 4%. EBITDA follows the same recovery path.
Currency: USD · Scale: money in millions, absolute · YoY uses the prior fiscal year from the feed; analyst count and range use the first displayed period.
| Metric | FY2027E | FY2028E | FY2029E | YoY | Analysts | Low / high |
|---|---|---|---|---|---|---|
| Revenue | $11.42bn | $11.86bn | $12.33bn | +1.8% | 14 | $11.21bn / $11.54bn |
| EPS (normalized) | $6.26 | $6.81 | $7.50 | -3.8% | 14 | $5.92 / $6.50 |
| EBITDA | $1.26bn | $1.31bn | $1.37bn | +2.4% | 11 | $1.22bn / $1.28bn |
Outer-year EPS estimates diverge widely — FY2029 spans $6.63 to $8.15
The FY2029 normalized-EPS range is wide on only seven analysts; the recovery thesis is far from settled the further out you look.
Currency: USD · Scale: money in millions, absolute · Spread/mean is absolute high-low divided by absolute mean.
| Metric | Period | Mean | Low–high | Spread/mean | Analysts |
|---|---|---|---|---|---|
| EPS (normalized) | FY2029E | $7.50 | $6.63–$8.15 | 20.3% | 7 |
| EPS (normalized) | FY2028E | $6.81 | $6.38–$7.12 | 10.9% | 12 |
| Revenue | FY2029E | $12.33bn | $11.88bn–$12.71bn | 6.7% | 7 |
Hold-heavy street; targets range from $65 to $140
Eight of fourteen ratings are holds, with three buys against one sell and two underperforms. The $65-$140 target range signals unusually split views on fair value.
Currency: USD · Scale: money in millions, absolute · Analyst counts shown explicitly.
| Street view | Reading | Analysts |
|---|---|---|
| Recommendation mix | Buy 3, Outperform 0, Hold 8, Underperform 2, Sell 1 | 14 |
| Consensus score | 2.86 | 14 |
| Target price | mean $84.00; median $77.50; high $140.0; low $65.00 | 12 |
Coverage thins sharply in FY2029
FY2029 revenue is covered by seven analysts and GAAP net income by only three. The far-year ranges should be read as directional, not settled.
Visible Alpha broker models via S&P Xpressfeed · 12 brokers · 359 line items · freshest revision 2026-07-22.
Key drivers
| Line | FY-2025A | FY-2026A | FY-2027E | FY-2028E | YoY | Brokers |
|---|---|---|---|---|---|---|
| Free Cash Flow | $892.00m | $881.12m | $867.75m | $933.91m | -1.5% | 12 |
| Free Cash flow per share($) | $6.94 | $7.20 | $7.29 | $8.07 | +1.2% | 12 |
| General & administrative expenses | $1.30bn | $1.30bn | $1.29bn | $1.33bn | -0.5% | 12 |
| Income/(loss) before income taxes | $1.19bn | $834.15m | $897.95m | $954.02m | +7.6% | 12 |
| Shares - Diluted(M#) | 128.37m Number | 122.35m Number | 119.04m Number | 115.80m Number | -2.7% | 12 |
| Total costs & expenses | $10.69bn | $9.55bn | $10.32bn | $10.69bn | +8.1% | 12 |
| Billable expenses | $3.79bn | $3.47bn | $3.51bn | $3.63bn | +1.2% | 11 |
| EPS - Diluted - Operating($) | $6.35 | $6.08 | $6.24 | $6.78 | +2.7% | 11 |
| EPS - Diluted($) | $7.17 | $6.50 | $5.93 | $6.44 | -8.8% | 11 |
| Income/(loss) from continuing operations | $904.93m | $797.17m | $703.41m | $741.96m | -11.8% | 11 |
Quarterly path
| Line | 2QFY-2026A | 3QFY-2026A | 4QFY-2026A | 1QFY-2027A | 2QFY-2027E | 3QFY-2027E | 4QFY-2027E | 1QFY-2028E | Brokers |
|---|---|---|---|---|---|---|---|---|---|
| Total revenue | $2.97bn | $2.73bn | $2.86bn | $2.82bn | $2.87bn | $2.78bn | $2.94bn | $2.93bn | 12 |
| EPS Diluted, Applicable to common stockholders($) | $1.51 | $1.28 | $1.34 | $1.49 | $1.58 | $1.51 | $1.66 | $1.62 | 12 |
| Free Cash Flow | $320.28m | $182.24m | $142.69m | $155.72m | $237.05m | $220.78m | $256.75m | $157.75m | 10 |
| Free Cash flow per share($) | $2.59 | $1.49 | $1.18 | $1.30 | $1.99 | $1.86 | $2.17 | $1.35 | 10 |
| General & administrative expenses | $357.48m | $321.68m | $347.50m | $315.75m | $320.39m | $320.53m | $332.10m | $331.26m | 12 |
Where broker models disagree
| Line | Period | Median | Q1–Q3 | Min–max | Brokers |
|---|---|---|---|---|---|
| Net proceeds from issuance of stock | FY-2027E | $6.00m | $0.00–$28.50m | $0.00–$45.00m | 6 |
| Other increase/(decrease) in current liabilities | FY-2027E | $8.06m | $-17.92m–$16.43m | $-94.35m–$34.00m | 6 |
| Increase/(decrease) in current liabilities | FY-2028E | $24.02m | $-21.41m–$60.41m | $-54.26m–$66.43m | 7 |
| Other (increase)/decrease in current assets | FY-2027E | $-5.57m | $-18.47m–$-1.00m | $-20.00m–$7.14m | 5 |
| Other operating adjustments | FY-2028E | $90.00m | $61.00m–$212.20m | $35.00m–$221.00m | 5 |
Headline P&L consensus, momentum and beat/miss live in the CapIQ tab.
Source: S&P Capital IQ transcripts via Xpressfeed · latest indexed call 2026-05-22 · generated 2026-07-24.
Latest call digest
Booz Allen Hamilton Holding Corporation, Q4 2026 Earnings Call, May 22, 2026 · 2026-05-22T12:00:00
Q4 FY2026 call — May 22, 2026. The prepared remarks framed fiscal 2026 as the hardest year Booz Allen has had as a public company: gross revenue fell to $11.2 billion, Civil declined sharply, and adjusted EBITDA landed around $1.2 billion at an 11% margin. Management introduced new CFO Troy Lahr and Kristine Anderson's added President title, then guided fiscal 2027 to revenue of $11.2–11.7 billion, adjusted EPS of $6–6.35 and free cash flow of $825–925 million, with National Security growing mid-single digits and Civil declining high single digits. In the Q&A the tone was more optimistic than the numbers, but analysts repeatedly pushed on where the guide's low-versus-high ends come from, the shape of a year that starts negative in Civil and improves in the second half, whether the funding recovery since January is durable or another head fake, and how headcount is being managed against a still-declining top line. Management leaned on cost discipline, the outcome-based/fixed-price transition and cyber/defense-tech growth vectors, and declined to size individual businesses when pressed.
Participant coverage from the latest call.
| Group | Participants | Count |
|---|---|---|
| Management | Operator; Dustin Darensbourg — Director & Head of Investor Relations, Booz Allen Hamilton Holding Corporation; Horacio Rozanski — CEO & Chair, Booz Allen Hamilton Holding Corporation; Kristine Anderson — COO & President, Booz Allen Hamilton Holding Corporation; Troy Lahr — Executive VP & CFO, Booz Allen Hamilton Holding Corporation | 5 |
| Analysts | Gavin Parsons — Analyst, UBS Investment Bank, Research Division; Louie Dipalma — Partner & Research Analyst of Industrials, William Blair & Company L.L.C., Research Division; Gautam Khanna — MD & Senior Analyst, TD Cowen, Research Division; John Godyn — Research Analyst, Citigroup Inc., Research Division; Unknown Analyst; David Strauss — Equity Analyst, Wells Fargo Securities, LLC, Research Division; Noah Poponak — Equity Analyst, Goldman Sachs Group, Inc., Research Division; Scott Mikus — Director of Aerospace, Defense and Space Research, Melius Research LLC; Sheila Kahyaoglu — Managing Director in Equity Research, Jefferies LLC, Research Division | 9 |
Curated latest-call exchanges; one row per analyst topic.
| Analyst | Firm | Topic | What changed in Q&A |
|---|---|---|---|
| Gavin Parsons | UBS Investment Bank, Research Division | Revenue growth decoupling from headcount; funded backlog to revenue | Asked how growth diverges from headcount and how funding awards convert to revenue after funded backlog fell; CEO tied divergence to outcome-based work and IP monetization and pointed to improved recent funding. |
| John Godyn | Citigroup Inc., Research Division | Shape of the fiscal-2027 guide, low vs. high end | Pressed twice for the drivers of the range and the intra-year cadence; management held to a Civil-pressured first half improving through the year but declined quarter-by-quarter detail. |
| Noah Poponak | Goldman Sachs Group, Inc., Research Division | Durability of the funding recovery | Asked why the improved funding is a real trend rather than another head fake; management cited a normalized-but-not-historic environment and would not call the future. |
| David Strauss | Wells Fargo Securities, LLC, Research Division | Civil sequential trajectory; sizing Space and Health | Sought clarity on whether Civil keeps rising sequentially and asked for growth figures on Space and Health; CEO declined to put specific numbers on those businesses. |
| Scott Mikus | Melius Research LLC | Buyback appetite under the executive order; cost-takeout retention | Questioned lighter repurchases and any EO constraint on capital returns; CFO reaffirmed dividend-first and continued buybacks and said the company keeps about 40% of the cost takeout. |
| Sheila Kahyaoglu | Jefferies LLC, Research Division | Headcount down 12% with revenue-per-employee up 6%; margins | Probed productivity gains and how the Civil mix affects fiscal-2027 margins; management flagged puts and takes but comfort with roughly flat ~11% margins. |
| Gautam Khanna | TD Cowen, Research Division | Procurement pace and IRS/Treasury reputational risk | Asked whether reputational issues blocked bids; management said conversations are productive and pointed to mid-single-digit National Security growth as evidence of no impediment. |
| Louie Dipalma | William Blair & Company L.L.C., Research Division | Agentic cyber demand and the Golden Dome OTA | Asked about agentic-AI cyber impact and the space-based interceptor award; CEO could not trace demand to a single event but reiterated accelerating cyber demand, and could not discuss the classified Golden Dome role. |
Theme tracker
Themes are curator-classified across supplied calls.
| Theme | Status | Quarters mentioned | Read-through |
|---|---|---|---|
| Bifurcation: National Security growth vs. Civil decline | persisted | Q4 2025, Q1 2026, Q2 2026, Q3 2026, Q4 2026 | The central framing of every recent call: Defense/Intel growing while Civil resets. It sharpened in Q2 2026 and remained the organizing lens through the latest guide. |
| Shift to outcome-based and fixed-price contracting | persisted | Q4 2025, Q1 2026, Q2 2026, Q3 2026, Q4 2026 | Positioned as both a delivery change and a margin lever; management describes a steady, contract-by-contract conversion accelerated by procurement reform rather than a step change. |
| Cyber productization (Thunderdome, Vellox, agentic cyber) | persisted | Q4 2025, Q2 2026, Q3 2026, Q4 2026 | Evolved from services and Zero Trust toward named products; Vellox Reverser reached general availability in Q3 2026 and the agentic-cyber pitch intensified into the latest call. |
| Cost reduction and delayering (~$150M annualized) | emerged | Q2 2026, Q3 2026, Q4 2026 | Announced in Q2 2026, executed in Q3 2026, and cited in Q4 2026 as roughly one-third realized in fiscal 2026 with the full run-rate landing in fiscal 2027; about 40% is retained. |
| Tech-ecosystem partnerships and Booz Allen Ventures | persisted | Q4 2025, Q1 2026, Q2 2026, Q3 2026, Q4 2026 | NVIDIA and AWS are long-standing; the a16z acceleration partnership and up-to-$400M fund commitment emerged in Q3 2026, and ventures gains increasingly touch EPS. |
| Golden Dome / space | persisted | Q4 2025, Q1 2026, Q3 2026, Q4 2026 | Discussed as a pursuit for several quarters and converted to a disclosed space-based interceptor OTA award by Q4 2026, though the role remains classified. |
| FY2021 Investor Day investment-thesis framing | dropped | Q3 2025, Q4 2025 | The multiyear EBITDA-target narrative anchored calls through the close of fiscal 2025, then disappeared once the thesis period ended; its absence reflects a completed goal rather than a reversal. |
Guidance ledger
Quotes, calls, and speakers are source-verified; outcomes are curator-classified.
| Verbatim guidance | Call | Speaker | Curator outcome | Outcome note |
|---|---|---|---|---|
| “We expect to deliver revenue between $12 billion and $12.5 billion.” | Booz Allen Hamilton Holding Corporation, Q4 2025 Earnings Call, May 23, 2025 · 2025-05-23T12:00:00 | Matthew Calderone | missed | This original fiscal-2026 range was cut over the following quarters; fiscal-2026 gross revenue finished at about $11.2 billion, below the low end. |
| “We expect to generate adjusted EBITDA dollars in the range of $1.315 billion to $1.37 billion.” | Booz Allen Hamilton Holding Corporation, Q4 2025 Earnings Call, May 23, 2025 · 2025-05-23T12:00:00 | Matthew Calderone | missed | Fiscal-2026 adjusted EBITDA came in around $1.2 billion per the Q4 2026 call, below this initial range. |
| “We now expect to deliver revenue between $11.3 billion and $11.5 billion.” | Booz Allen Hamilton Holding Corporation, Q2 2026 Earnings Call, Oct 24, 2025 · 2025-10-24T12:00:00 | Matthew Calderone | missed | Even this lowered range proved slightly high; fiscal-2026 revenue landed near $11.2 billion, at or just below the bottom. |
| “restructuring our business to take out a net incremental $150 million of cost on an annualized basis” | Booz Allen Hamilton Holding Corporation, Q2 2026 Earnings Call, Oct 24, 2025 · 2025-10-24T12:00:00 | Matthew Calderone | kept | Later calls confirmed the actions were executed, with run-rate spend dropped by roughly $150 million and about one-third realized in fiscal 2026. |
| “We now expect free cash flow to be between $900 million and $1 billion.” | Booz Allen Hamilton Holding Corporation, Q1 2026 Earnings Call, Jul 25, 2025 · 2025-07-25T12:00:00 | Matthew Calderone | kept | Despite later downward revisions to the free-cash-flow range, fiscal-2026 free cash flow of $951 million fell within this raised range. |
| “we expect to deliver revenue between $11.2 billion and $11.7 billion” | Booz Allen Hamilton Holding Corporation, Q4 2026 Earnings Call, May 22, 2026 · 2026-05-22T12:00:00 | Troy Lahr | pending | Fiscal-2027 revenue guidance issued on the latest call; no subsequent call in the set to judge the outcome. |
| “We expect adjusted EPS to be in the range of $6 to $6.35.” | Booz Allen Hamilton Holding Corporation, Q4 2026 Earnings Call, May 22, 2026 · 2026-05-22T12:00:00 | Troy Lahr | pending | Fiscal-2027 adjusted EPS guidance; outcome not yet observable in the supplied call history. |
Q&A pressure map
Question counts and firms are curator tallies; analyst coverage shown above.
| Topic | Questions | Firms | Pressure / response |
|---|---|---|---|
| Civil decline and the timing of a return to growth | 9 | Jefferies LLC, Research Division, Cantor Fitzgerald & Co., Research Division, William Blair & Company L.L.C., Research Division, Citigroup Inc., Research Division, Wells Fargo Securities, LLC, Research Division, BofA Securities, Research Division | The most persistent line of questioning across the last five calls; analysts repeatedly asked when Civil bottoms and inflects, and management kept pointing the recovery further out — into the second half, then the next fiscal year. |
| Funding and procurement pace vs. funded-backlog conversion | 6 | TD Cowen, Research Division, UBS Investment Bank, Research Division, Goldman Sachs Group, Inc., Research Division, JPMorgan Chase & Co, Research Division, William Blair & Company L.L.C., Research Division | Analysts pressed on the gap between strong awards and soft funded backlog and on whether the post-shutdown pickup is durable; management conceded a choppier, more episodic funding pattern than in prior years. |
| Headcount managed against a declining top line | 5 | Jefferies LLC, Research Division, Melius Research LLC, TD Cowen, Research Division, UBS Investment Bank, Research Division | Recurring questions on whether revenue can grow faster than headcount and whether cuts risk being overdone; management pointed to fixed-price mix, higher utilization and AI-assisted productivity. |
| Sizing individual businesses (Space, Health, Cyber) | 2 | Wells Fargo Securities, LLC, Research Division, BofA Securities, Research Division | When asked to quantify specific businesses, management declined — in Q4 2026 the CEO said it was very hard to put a specific number on Space or Health, and in Q2 2026 the cyber business was not sized. The answers plainly did not provide the figures requested. |
| Capital returns and buybacks under the executive order | 2 | Melius Research LLC, Truist Securities, Inc., Research Division | Analysts asked whether the executive order on capital returns constrains repurchases; management said it does not apply to Booz Allen negatively and reaffirmed dividend-first, opportunistic buybacks. |
Language shifts
Only language evidence verified against the referenced component is shown.
| Observation | Verbatim evidence | Call ID | Component |
|---|---|---|---|
| A new caution word entered the vocabulary in Q2 2026 — management began labeling the Civil/National Security split a 'bifurcation' and reached for superlatives to describe the environment, a framing that then recurred. | “This is the most bifurcated environment I have seen in my decades with Booz Allen.” | 1960390514 | 2 |
| The Q2 2026 call marked the clearest drop in confidence in the set, with the CEO plainly conceding disappointment while cutting guidance across the board. | “I am disappointed in our results this quarter and that we are lowering guidance across all key metrics.” | 1960390514 | 2 |
| By the latest call the register shifted from crisis to recovery: the CEO acknowledged the hardest year on record but paired it with a forward claim of strength. | “Fiscal year 2026 was the most challenging year we faced as a public company.” | 1994235646 | 2 |
| 'Choppy' and 'volatility' became standing hedges on the market outlook, carried into the fiscal-2027 framing rather than presented as a one-time disruption. | “still a market that will experience volatility and some choppiness” | 1994235646 | 9 |
The call history documents a full guidance-down cycle through fiscal 2026 — two revenue cuts and a missed EBITDA range — followed by a latest call that pairs a stabilized cost base and improving funding with a still-cautious, Civil-pressured fiscal-2027 setup. For the current debate, the useful signal is that management has consistently pushed the Civil inflection outward while National Security and the outcome-based transition carry the growth story; the durability of the post-January funding recovery is the swing factor to watch.
Booz Allen Hamilton: a government compounder, marked down
Booz Allen Hamilton sells advanced-technology and consulting work almost entirely to the U.S. government — roughly 98% of revenue [1]. For a decade the stock compounded from a $19 IPO to a $186 peak in October 2024. It then lost roughly two-thirds of its value as federal budget retrenchment hit its Civil business. The franchise still throws off cash; the multiple no longer treats it as a grower. This chapter sets out what the company is, how it earns, and the question the rest of the report exists to answer.
What the company is
Booz Allen Hamilton Holding Corporation (NYSE: BAH) is a McLean, Virginia advanced-technology and consulting firm, incorporated in Delaware in 2008 and run as a single reportable segment [2]. Its business is putting cleared, credentialed people and, increasingly, proprietary technology against the missions of U.S. defense, intelligence, and civilian agencies. At March 31, 2026 it employed about 31,500 people, of whom 28,800 were client-facing staff, and roughly 77% held U.S. government security clearances [3]. Management now frames the company as an "advanced technology" business rather than a pure consultancy, positioning itself as the federal government's largest AI provider with roughly 400 active AI projects alongside one of the larger cyber practices serving federal and defense customers [4].
FY2026 Revenue ($M)
Net Income ($M)
Free Cash Flow ($M)
Total Backlog ($M)
Sources: FY2026 revenue and net income per the FY2026 Form 10-K [5]; free cash flow and total backlog per the Q4 FY2026 earnings presentation [6].
Market Cap ($M)
P/E (GAAP)
FCF Yield
Dividend Yield
Source: derived from the $65.87 close on July 24, 2026 and 122.4M diluted shares, against reported FY2026 free cash flow and the $0.59 quarterly dividend [7].
How it makes money
Two lenses matter. By customer, the book splits into a National Security core — Defense and Intelligence agencies — and a Civil-and-Commercial remainder that is dominated by federal civilian agencies. In FY2026 National Security customers were 71% of revenue and grew about 2%, while Civil and Commercial fell 22% [8]. The core held while the civilian side broke; that split accounts for the year.
Source: FY2026 Form 10-K, Note 3 Revenue (revenue by customer type, FY2024–FY2026) [9].
By contract, the economics are those of a cost-plus government contractor, not a fixed-price builder: 59% of FY2026 revenue was cost-reimbursable, 22% time-and-materials, and 19% fixed-price [10]. Most of the book bills labor and reimbursable costs to the government at a margin, which is why the model generates steady cash but modest reported margins, and why headcount tracks revenue closely — cost of revenue fell alongside revenue in FY2026 as staff were cut [11].
A decade up, a year down
From its November 2010 IPO the stock compounded steadily, reaching a $186 close on October 28, 2024. It has since fallen to about $66 — a drawdown of roughly 65% from the peak, giving back several years of gains.
Source: daily closing prices, as reported; FY2024 close $148.44, October 2024 peak $186.00, July 24, 2026 close $65.87.
The de-rating is not only price — it is the multiple. At the peak the market paid roughly 25 times earnings for a business growing double digits. At $66 it pays about 9.5 times GAAP earnings and roughly 9 times enterprise value to adjusted EBITDA, valuing Booz Allen as a slow-growth contractor rather than a compounder. Underlying earnings did not collapse to match: net income fell only 9% in FY2026, to $851 million, and adjusted diluted EPS actually rose to $6.51 [12].
Source: derived from reported financials, FY2022–FY2026 Forms 10-K [13].
What broke, and what held
FY2026 was, in the CEO's words, "the most challenging year we faced as a public company," driven by "unprecedented headwinds" in the Civil business [14]. The proximate causes were a slowed federal procurement and funding environment, a government shutdown in the third quarter, and a broad U.S. government push to reduce spending across civilian, defense, and intelligence agencies [15], [16]. Revenue fell 6% and the company cut headcount from about 35,800 to 31,500 to defend margins.
What held is the other half of the ledger. Total backlog reached a record $38.2 billion, up from $37.0 billion a year earlier, with a trailing book-to-bill of 1.1x [17], [18]. Free cash flow was $951 million, and the company returned $837 million to shareholders through buybacks and a raised $0.59 quarterly dividend [19]. The balance sheet is levered but not stretched: net debt of roughly $3.2 billion sits at about 2.6 times adjusted EBITDA, and the business remains solidly investment-grade — a point that matters for a reader who wants the chance of insolvency to be near zero.
The FY2026 story is bifurcated: a 22% drop in Civil and Commercial revenue drove a 6% top-line decline, while the National Security core grew, backlog hit a record, and free cash flow held near $950 million.
The question this report answers
For FY2027 management guides to revenue of $11.2–$11.7 billion — flat to 4% growth — with adjusted EPS of $6.00–$6.35 and free cash flow of $825–$925 million [20]. That is a stabilization budget, not a recovery one: it assumes the Civil bleeding slows while National Security keeps the total roughly flat, and it brackets a year in which the company grows into a share count it has been steadily shrinking.
At about $66, Booz Allen trades near 9.5 times GAAP earnings and an 11.8% free-cash-flow yield — pricing that already embeds a materially smaller federal purse. The question this report addresses: is Booz Allen's roughly 65% de-rating a durable impairment of a government-services franchise now facing structurally lower federal spending, or the trough of a policy-driven cycle in a cash-generative, backlog-rich business whose National Security core keeps growing — and how much of that pessimism a single-digit multiple already reflects. The chapters that follow test each part of that question in turn: the three-year financials and estimates, the durability of the National Security core, the depth and duration of the Civil shock, earnings and cash quality, the growth engine, who owns and runs the company, and what the price implies against the forward numbers.
Financials and Estimates
Over the last three years Booz Allen grew revenue from $10.7B to a $12.0B peak and back to $11.2B [1], while free cash flow swung far more than the income statement — from $192M in FY2024 to roughly $950M in each of FY2025 and FY2026 [2]. The reported earnings decline looks mild, but most of what cushioned it does not repeat.
Booz Allen's FY2026 net income fell only 9% while operating income fell 25% — a gap bridged by a tax charge that collapsed from $284M (23.3%) to $11M (1.3%) — and the FY2025 base it is measured against was itself inflated by ~$237M of one-time settlement benefits ($122M reserve release + $115M insurance recovery) while the FY2026 result was defended by a 12% workforce cut (~35,800 to ~31,500) and $61M of severance, so the earnings 'resilience' is largely constructed rather than operational. [3][4][5][6], Notes — Severance and Related Charges — p.135"), Notes — Severance and Related Charges — p.135").
Each leg is sizeable against the −9% headline: a $273M tax swing ($284M to $11M), a FY2025 base lifted roughly $237M by non-recurring settlement items, and $61M of severance behind the headcount cut [7]. On management's own bridge, the run-rate to anchor a multiple on is nearer $5.90 a share than the $6.90 GAAP or $6.51 adjusted figures [8]. The counter is equally concrete: the largest single piece of the low tax rate — the $103M R&D credit — is structural and recurs [9], and FY2027 guidance still lands at $6.00–$6.35 on a normalized 20–23% tax rate, so the clean base is real rather than a one-off [10].
Why net income held up better than operating income
The gap between the −25% operating-income decline and the −9% net-income decline is worth pausing on, because it is where the earnings quality lives. Operating income fell from $1,370M to $1,033M as margin compressed from 11% to 9% [11]. Below the operating line, interest expense rose to $184M and pre-tax income landed at $862M — yet the tax charge collapsed from $284M (a 23.3% rate) to $11M, a 1.3% effective rate [12]. That $273M tax swing is why net income of $851M looks resilient.
The tax note itself separates the recurring from the one-off. Against the 21% federal statutory charge of $181M, research-and-development credits removed $103M (12.0 points) and a favorable change in uncertain tax positions removed a further $80M (9.3 points) [13]. The R&D credit is a repeatable feature of a labor-and-engineering business; the reserve release is not.
Management's own bridge does the subtraction. Its FY2027 earnings bridge starts from the $6.51 adjusted EPS reported for FY2026, removes $0.11 of unrealized venture-investment gains and $0.50 of "non-recurring portion of R&D tax credit benefit," and arrives at a clean base of $5.90 [14]. Two facts follow. First, this is one of the rare cases where GAAP diluted EPS ($6.90) sits above the adjusted figure ($6.51) — the ordering is inverted precisely because GAAP captured the tax benefit that the non-GAAP measure normalizes away [15]. Second, the honest run-rate to anchor a valuation on is nearer $5.90 than $6.90.
The durability of the read turns on the R&D-credit level holding and on whether reserve releases keep recurring; a snap-back to a full statutory rate on the current pre-tax base would cut EPS by roughly a dollar.
The three-year record
FY2026 Revenue
▼ -6.4% YoY
Operating Income
▼ -24.6% YoY
Net Income
▼ -9.0% YoY
Free Cash Flow
▲ 4.4% YoY
Source: FY2026 Annual Report (Form 10-K), Consolidated Statements of Operations and Cash Flows [16] [17].
The revenue line tells a cyclical, not linear, story. Revenue rose 12% in FY2024 and 12% again in FY2025 to $11,980M, then fell 6% to $11,217M in FY2026 as a slowed procurement environment — including the third-quarter government shutdown — cut headcount and billable expenses [18]. Operating margin has been just as variable: 4.8% in FY2023, recovering to a 11.4% peak in FY2025 before settling at 9.2% in FY2026. FY2023 is the useful precedent — a prior margin trough the business worked its way out of within two years.
Source: FY2026 Annual Report (Form 10-K), Consolidated Statements of Operations [19]; FY2022–FY2024 from FY2024 Annual Report (Form 10-K) [20].
Source: derived from reported operating income and revenue, FY2024–FY2026 Annual Reports [21] [22].
Cash economics
Free cash flow is the number this business is usually bought for, and it has been the least stable line of all. Operating cash flow was $259M in FY2024, $1,009M in FY2025, and $1,041M in FY2026; against modest capital spending of $67M, $98M and $90M, free cash flow ran $192M, $911M and $951M [23].
Source: FY2026 Annual Report (Form 10-K), Consolidated Statements of Cash Flows and Operations [24].
Both extremes have identifiable, non-recurring mechanisms. The FY2024 trough was a cash-tax event: the required capitalization of research costs drove large tax payments and a $270M build in receivables, so only 43% of that year's $606M net income converted to operating cash [25]. FY2026 flatters in the opposite direction: as revenue shrank, receivables unwound, releasing $207M of cash and lifting operating cash flow above net income even as the business contracted [26]. Excluding that working-capital tailwind, underlying free cash flow is nearer $750M. Across all three years, cumulative free cash flow of $2.05B against $2.39B of net income is a 86% conversion rate — respectable, but flattered at the front by FY2026 and depressed at the back by FY2024, so no single year is a clean run-rate.
Balance sheet and the bankruptcy question
For a reader who wants the chance of ruin near zero, the debt is serviceable but the equity offers no asset cushion. Net debt was $3,212M at FY2026 — total debt of $3,940M less $728M of cash — against adjusted EBITDA of $1,229M, or about 2.6x [27] [28]. Operating income covers net interest 5.6 times, and total liquidity was $2.2B — $728M of cash plus $1.5B available under the revolver — with the nearest large maturity being the 5.95% notes due 2035 [29]. On coverage and maturity profile, near-term default risk is low.
The asset side is the caution. Reported equity is only $1,105M, and that already sits after $3,673M of treasury stock accumulated through years of buybacks; goodwill ($2,399M) and other intangibles ($509M) together are 41% of the $7,118M balance sheet [30]. Net of those soft assets, tangible book equity is roughly negative $1.8B. This is a cleared-workforce-and-contracts business, not an asset play: the margin of safety, if there is one, has to come from cash flow and backlog coverage, not from anything a liquidator could sell.
Source: FY2026 Annual Report (Form 10-K), Consolidated Balance Sheets; tangible equity derived as reported equity less goodwill and intangibles [31].
Capital returns stayed heavy through the downturn. In FY2026 the company paid $276M of dividends ($2.24 per share, since raised to $0.59 quarterly) and repurchased 5.6 million shares for $561M, with $684M left under the authorization [32]. Combined returns of roughly $837M sat just inside the $951M of free cash flow — sustainable at this level, but with little room to spare if free cash flow reverts toward the underlying $750M.
Forward estimates
Management's FY2027 guidance is for stabilization rather than recovery: revenue of $11.2–$11.7B (0–4% growth), adjusted EBITDA of $1,240–$1,290M at roughly 11% margin, adjusted EPS of $6.00–$6.35, and free cash flow of $825–$925M. The guide explicitly assumes the tax rate normalizes to 20–23% and capital spending steps up to $220M, of which $105M is a new headquarters [33]. Sell-side consensus is close to the midpoint — roughly $11.4B of revenue and $6.29 adjusted EPS for FY2027, building to about $11.9B and $6.85 for FY2028 — with a mean price target near $79 against the current $66, but a rating split that skews cautious: of 13 analysts, two buys, eight holds and three sells (per compiled analyst estimates).
Source: FY2025–FY2026 reported revenue, FY2026 Annual Report (Form 10-K) [34]; FY2027–FY2028 are compiled analyst consensus.
One forward-looking anchor cuts against the falling top line: total backlog rose to $38,187M at FY2026 from $37,027M a year earlier, so contracted future work grew even as recognized revenue fell [35]. Backlog is a coverage signal, not a timing guarantee — funded backlog is only $4,319M of that total, and the rest depends on options being exercised and appropriations flowing — but a building book while revenue troughs is more consistent with a cyclical pause than a structural unwind.
On the current $66 price and about 120 million diluted shares, the market values the equity near $7.9B and the enterprise near $11.1B. That is roughly 10.5x consensus FY2027 adjusted EPS, about 9x enterprise value to FY2027 EBITDA, and an 11% free-cash-flow yield on the guidance midpoint, with a 3.6% dividend yield alongside. Against a clean earnings base of $5.90 the multiple is nearer 11x. Whether that is cheap turns on the durability of the National Security core and the depth of the Civil trough — the operating questions this chapter's financials frame but do not settle.
The Cleared Moat
Booz Allen's defensibility rests on four things that are hard to copy: a security-cleared workforce, incumbency on thousands of task orders, revenue spread so thin no single contract matters, and its position as the federal government's largest AI provider. The recompete win rate — roughly nine in ten every year for six years — is the cleanest external read that the franchise still holds. The harder question is what that retained share is now worth, because the same fiscal 2026 filing that shows the moat intact also shows the revenue behind it shrinking.
Booz Allen won about 89% of its FY2026 recompetes and kept roughly nine in ten held contracts, but management says the recompetes coming back carry 'shorter periods of performance and smaller scope', and only $4.3 billion (11%) of the record $38.2 billion backlog is funded — with $23.7 billion in priced options dependent on future appropriations — so the moat holds contract share even as the revenue that share represents is structurally shrinking [1] [2].
The stakes sit in the composition of that backlog, not in the win rate. An 89% recompete rate defends share, but of the record $38.2 billion only $4.3 billion (11%) is funded; $10.2 billion is unfunded and $23.7 billion is priced options that convert only if customers exercise them and Congress appropriates the money, and the Civil recompetes coming back are shorter and smaller [3] [4]. The counter sits in the same numbers: for an incumbent winning about nine in ten of the contracts it defends, priced options and unfunded backlog have historically converted at high rates, and total backlog still grew about 3% in a down year — additions to funded backlog were $11.1 billion in fiscal 2026 — so an 11%-funded book is normal for a services business billed as the work is performed rather than evidence of weakness [5]. What is genuinely new is the shape of the returning work, not the funded ratio; the rest of this chapter measures how firmly the share itself is held.
What the moat is made of
Booz Allen competes for U.S. government work against enterprise-software firms, global technology providers, the large defense primes, pure-play services contractors, and startups — and it says it wins on technical capability, past performance, its relationships with customers, pricing, and its ability to recruit and retain skilled, security-cleared talent [6]. None of those is a patent. Three of them are structural barriers that take a rival years to reproduce.
The first is clearances. About 77% of the roughly 31,500-person workforce holds a security clearance [7] — a share that has risen since the 2010 IPO, when 71% held clearances and a quarter of the firm sat at the Top Secret/Sensitive Compartmented Information level [8]. A cleared analyst cannot be hired on a day's notice; the vetting is expensive, slow, and government-controlled, which is exactly what makes an installed base of cleared staff a barrier rather than a cost line.
The second is spread. Booz Allen delivered under 5,026 contracts and task orders in fiscal 2026, and about 84% of revenue came from 2,426 active task orders under IDIQ vehicles [9]. The largest single task order was about 4% of revenue and the largest definite contract about 1% [10]. No one lost re-compete sinks the year; the franchise is an aggregation of thousands of small mission footholds, not a handful of mega-programs.
Workforce cleared
FY2026 recompete win rate
Revenue via IDIQ task orders
Active AI projects
Sources: FY2026 Form 10-K — Our People and Culture and Contracts [11] [12]; win rate p.9 [13]; AI projects p.7 [14].
The third barrier is technical position, and it is the one management is spending against hardest. Booz Allen describes itself as the federal government's largest AI provider, with roughly 400 active AI projects, and frames its VoLT strategy — Velocity, Leadership, Technology — around building specialized products at speed through venture investments and partnerships with hyperscalers and defense-tech firms [15]. That claim is harder to verify from the outside than a clearance count, but it is consistent with where the growth has been.
Nine in ten recompetes, six years running
The single most useful moat gauge Booz Allen discloses is its win rate on re-competed contracts — the work already held, put back out to bid. If incumbency were weak, this is where it would show. It does not. The recompete win rate has sat between 88% and 92% every year since fiscal 2021, and was 89% in fiscal 2026 [16].
Sources: win rates as reported in each fiscal year's Form 10-K — FY2026 and FY2025 [17]; FY2024 and FY2023 [18]; FY2022 and FY2021 [19].
The gap between the two lines is the point. Retaining held work at ~90% is a very different business from winning new work at 56–66%. It says the franchise's defensive perimeter is strong even when its offensive one is ordinary, and it is why the company can lose a competitive-bid cycle and still grow — the base rarely leaks. The new-business win rate is more volatile and has drifted down from 66% in fiscal 2023 to 57% in fiscal 2026 [20], which matters more for the growth case than for the moat.
The national-security core held
The fiscal 2026 revenue decline was not a franchise failure; it was a customer failure, and a specific one. Defense and Intelligence together grew about 2% to $7.97 billion while Civil and Commercial fell 22% to $3.25 billion — the shock was concentrated where federal-civilian budgets were cut, not in the National Security core, which has grown in each of the last three years [21]. The customer-by-customer detail and the budget backdrop are treated in Federal Demand.
The demand pull sits with the highest-priority missions: the Department of Veterans Affairs alone was the single largest customer at 10% of revenue [22], and the defense and intelligence work is anchored to warfighter, cyber, and intelligence-community programs that are less exposed to civilian-efficiency cuts.
Where the moat is thinning
A durable moat is not a static one, and three cracks are visible. First, the recompete win rate, while high, slipped from 92% in fiscal 2024 and 2025 to 89% in fiscal 2026 [23]. Three points is within the historical band, but it is a downtick in the metric that most defines the franchise, in the same year the environment turned — worth watching rather than dismissing.
Second, procurement reform cuts against the shape of Booz Allen's book. A fiscal 2026 executive order, "Promoting Efficiency, Accountability, and Performance in Federal Contracting," directs agencies to increase the use of firm-fixed-price contracts for new awards to the maximum extent consistent with law [24]. Cost-reimbursable work was 59% of fiscal 2026 revenue [25]; a durable shift toward fixed-price awards would move risk onto the contractor and pressure the margin structure, however gradually.
Third, the offense is softer than the defense. The new-business win rate has fallen to 57%, and the growth engine now leans on the National Security core continuing to expand while Civil finds a floor. The moat protects what Booz Allen already has; it does not, on its own, guarantee the next leg of growth.
Scale among the named rivals
Booz Allen does not name its competitors in the fiscal 2026 filing, but its own compensation peer group and the broader federal-services set place it against a familiar field. Among the pure-play federal contractors, it is the second-largest by revenue — behind Leidos, ahead of CACI, SAIC, Parsons, and Maximus — and its operating margin, even in a trough year, sits in the upper half of the group.
Sources: most recent Form 10-K per company (fiscal year-ends differ): Booz Allen (year ended March 2026) [26]; Leidos (Jan 2025) [27]; CACI (Jun 2025) [28]; SAIC (Jan 2025) [29]; Parsons (Dec 2024) [30]; Maximus (Sep 2024) [31].
The scale table carries a caveat: these firms are not identical. Leidos is larger but more diversified, carrying health, commercial, and security-products lines outside the pure government-services model [32], and Maximus is weighted toward health and human-services business-process work rather than defense and intelligence. The head-to-head national-security rivals are CACI and SAIC, and Booz Allen is bigger than both. Size is not itself a moat, but in a market where past performance and the ability to field cleared teams at scale are award criteria, being the second-largest player is a structural advantage that compounds with the clearance and incumbency barriers above.
What the evidence supports
The weight of the evidence favours a durable franchise over an eroding one. The recompete win rate — the cleanest external read on incumbency — has held near 90% for six years and through the fiscal 2026 shock; the National Security core grew while Civil fell; backlog set a record; and Booz Allen enters the AI-procurement wave as the largest federal provider and the second-largest pure-play by revenue. That is the raw material of a business the market is pricing as impaired.
The strongest fact against the read is that the moat's best metrics are lagging and its softer ones are turning: the recompete rate ticked down to 89%, the new-business win rate has fallen to 57%, and a procurement shift toward fixed-price awards presses on a book that is still 59% cost-reimbursable. What would change the read is a second consecutive year of falling recompete win rates, or National Security growth stalling — either would suggest the erosion is structural rather than a single hard year. On the evidence to date, the moat is intact and the core is holding; the burden is on the bear to show that the fiscal 2026 cracks widen rather than close.
Federal Demand
Booz Allen's revenue moves with one buyer's checkbook, the U.S. government, and in FY2026 that book bifurcated. National Security customers (71% of revenue) sit inside a defense, cyber, and AI budget the administration wants to grow toward record size; Civil and Commercial customers (29%) absorbed the sharpest reset in a generation as the efficiency drive slowed procurement and cut programs. The demand evidence points to a cyclical trough on the core and a structural rebasing of Civil, not a broad franchise failure — though the Civil recovery is arriving in smaller pieces that translate into revenue more slowly than the business that declined.
A bifurcated buyer
Management's own word for the demand picture is "bifurcation" [1]. The revenue-by-customer record makes the split concrete: over FY2024–FY2026 the National Security book (Defense plus Intelligence) grew from $6.82 billion to $7.97 billion — up about 17% across two years — while Civil and Commercial fell from a FY2025 peak of $4.17 billion to $3.25 billion, a 22% single-year drop [2]. The mix shifted with it: National Security rose from 64% of revenue to 71% in two years.
Source: FY2026 Annual Report (Form 10-K), revenue by customer [3].
National Security Share of Revenue (FY2026)
National Security Revenue YoY
Civil & Commercial Revenue YoY
Source: derived from FY2026 Annual Report (Form 10-K), revenue by customer [4].
The two books face opposite conditions. One, management said, faces "the toughest market conditions we've seen in a generation"; the other "operates in a much more favorable environment" [5]. Reading each side on its own is what the demand question requires.
The Civil reset: structural or cyclical
The Civil shock has an identifiable cause. The FY2026 10-K describes reviews of spending "to ensure it aligns with the administration's priorities of maximizing governmental efficiency," under which contracts were "impacted, reduced or canceled," alongside "price adjustments and renegotiations" [6]. Personnel cuts at customer agencies and executive orders on procurement produced "a slowed procurement environment, with delays in the granting of new contract awards" and "a substantial reduction in the ordinary end of government fiscal year funding surge" [7]. This is a demand shock, not an execution failure.
The more useful evidence is how management's characterization moved across three consecutive quarters — the promise-versus-delivery record the transcript archive makes possible.
Sources: Q2 FY2026 transcript [8]; Q3 FY2026 transcript [9]; Q4 FY2026 transcript [10].
The arc reads as a cyclical bottom: no new declines through the back half of FY2026, then a positive Civil book-to-bill of 1.2x by Q4 [11]. The COO's framing is that the missions themselves endure — "Still need a strong FAA and aviation safety. You still need to deliver healthcare. You still need secure borders" — while "the focus area has changed" [12]. Enduring missions argue against permanent impairment of the addressable market.
Two facts cut the other way, and they are what make the reset partly structural rather than purely cyclical. First, the recovery is arriving in smaller pieces: management flagged that "many recompetes have shorter periods of performance and smaller scope," so "it will take time for the uptick in demand to translate into growth," and it guided Civil to further high-single-digit declines in FY2027 [13]. A market that awards more but smaller contracts is a structurally lower-revenue market even once volumes stabilize. Second, a meaningful slice of the Civil pipeline sits in the Department of Homeland Security, where FY2026 funding was provided "only on a partial basis" with immigration enforcement components "subject to funding uncertainty" [14] — a headwind management named specifically for the year ahead [15].
The franchise's headline durability metrics, set out in The Cleared Moat, show the same shape. Booz Allen won about 89% of its FY2026 recompetes and kept roughly nine in ten held contracts, but management says the recompetes coming back carry 'shorter periods of performance and smaller scope', and only $4.3 billion (11%) of the record $38.2 billion backlog is funded — with $23.7 billion in priced options dependent on future appropriations — so the moat holds contract share even as the revenue that share represents is structurally shrinking. [16] [17] [18]
The read that fits the evidence: Civil is bottoming cyclically but rebasing structurally lower. The counter-fact a skeptic should hold is that this narrative comes from a management team that reduced Civil guidance repeatedly through FY2026, so "reset and accelerating" is a claim to verify against Civil book-to-bill and revenue in FY2027, not to bank.
The National Security tailwind
The other half of the buyer is where the industry tailwind lives, and it is exogenous — a budget the company does not control. Peer disclosures frame the magnitude cleanly. Defense was funded for GFY2025 under a full-year continuing resolution that set the base at $893 billion, with bipartisan support that CACI calls "constructive" given "the heightened current global threat environment" [19]. For GFY2027, the administration submitted a $1.5 trillion defense budget — a $1.15 trillion base plus $350 billion of reconciliation funding — which Parsons describes as "a 44% increase over current funding levels" and "the largest defense budget in history" [20].
GFY2025 Defense Base, Enacted ($B)
GFY2027 Defense Request ($B)
Proposed Increase vs Current
Sources: CACI FY2025 10-K, GFY2025 full-year CR base of $893B [21]; Parsons Q1 FY2026 call, GFY2027 request of $1.5T ($1.15T base plus $350B reconciliation) [22].
Booz Allen is positioned against the priorities that budget funds. In Q4 FY2026 it won $1.7 billion of national-security work [23], including an Other Transaction Authority award on Golden Dome — the space-based missile-defense program — and BEATS, a $937 million single-award Army engineering contract [24]. Cyber is scaling into AI: the firm responds to "over 1,000 cyber incidents a year," is fast-tracking its agentic Vellox product suite, and bought Defy Security to expand commercial reach [25]. Its shift toward outcomes-based procurement is visible in the deal mix — roughly a 90% rise in OTA proposal submissions and a 50% rise in OTA awards year over year [26].
The tailwind is real but should not be over-drawn, for two reasons. National Security grew only about 2% in FY2026 despite this backdrop [27], because a larger topline does not mechanically convert to Booz Allen revenue: as the CEO put it, "most of our work does not sit at the line items in the budget," so what matters is "the overall certainty our customers feel about having the money there" [28]. And the company's own FY2027 guidance does not assume the $1.5 trillion figure lands [29] — a conservatism worth crediting, and a reminder that the record-budget headline is a proposal, not enacted appropriations.
Regulatory crosscurrents worth watching
The same efficiency drive that reset Civil is reshaping how all federal work is bought, and the direction cuts both ways for Booz Allen. An April 2026 executive order directs agencies to "increase the use of firm-fixed price contracts…to the maximum extent" and to renegotiate their largest non-fixed-price awards [30]. That pressures a book still 59% cost-reimbursable, but the company frames it as opportunity: fixed-price and outcomes-based work "generally offers higher margin opportunities because we receive the benefits of any cost savings," while carrying "greater financial risk" on overruns [31]. Whether that lifts or squeezes margins is a genuine open question, not a settled loss.
One order deserves the reader's attention because it touches the capital-return case directly (Ownership and Pay). A January 2026 executive order, "Prioritizing the Warfighter in Defense Contracting," empowers the Secretary of War to identify underperforming defense contractors that have "engaged in any stock buy-back or corporate distribution," with the potential to restrict their dividends and buybacks; proposed Senate legislation would go further with a "blanket prohibition" absent a waiver [32]. The order targets underperformers, so it is a tail risk rather than a base case, but it is the kind of item that would change a shareholder-return thesis if it landed.
The watch items are falsifiable. Civil book-to-bill above 1.0x and a return to sequential Civil revenue growth in the FY2027 second half would confirm the cyclical-trough read; continued declines through FY2027 would tilt it toward structural impairment. GFY2027 defense appropriations enacted near the request would firm the National Security tailwind; another full-year continuing resolution would blunt it. And any identification of Booz Allen under the January 2026 order would put its $837 million of annual capital returns in play. On the balance of demand evidence today, the trough reading is better supported than the impairment reading — but it rests on a National Security core doing the heavy lifting while Civil recovers into a smaller shape than it left.
The Growth Engine
Booz Allen's growth engine — AI, cyber, and defense technology — is real: AI revenue grew about 30% to roughly $800 million in FY2025, and the firm is the federal government's largest AI provider [1]. But at around 7% of revenue it is still too small to outrun a $922 million Civil decline, its precise size is no longer disclosed, and management is funding it partly by redirecting capital away from buybacks into $500 million of illiquid venture commitments [2]. Whether this engine scales fast enough to carry the National Security core remains unproven.
What the engine is
The clearest evidence that Booz Allen is more than a labor-arbitrage staffing house is its artificial-intelligence business. Management sized it at nearly $600 million in FY2024 and about $800 million in FY2025, a gain of over 30% in a single year, and cited Deltek's ranking of the firm as the leading AI provider to the federal government [3] [4]. The FY2026 10-K describes roughly 400 active AI projects spanning agentic AI, physical AI, and AI-Radio Access Networks, alongside a cyber business protecting federal, defense, and Fortune 500 customers [5].
AI Revenue FY2025 ($M)
AI as % of Revenue FY2025
Total Revenue FY2025 ($M)
Sources: AI revenue as disclosed on the Q4 FY2025 call [6]; total revenue per the FY2026 10-K, as reported.
The engine is broader than AI. In FY2026 the firm reported a nearly 90% rise in Other Transaction Authority (OTA) proposal submissions and about a 50% rise in OTA awards — the faster, commercial-style contracting the administration is pushing — plus new product lines in its Vellox cyber suite and EdgeXtend edge-computing family, and partnerships with Nvidia, AWS, and a16z portfolio companies [7]. Management frames these as its "growth vectors" and, for FY2027, organizes the entire strategy around them: accelerating cyber and defense tech, injecting AI into all work, seeding the next wave (physical AI, quantum, 6G, AI-RAN), and monetizing its venture network [8]. The single largest near-term prize the firm names is Golden Dome missile defense, funded at $25 billion in the reconciliation package with roughly $24 billion in adjacent missile-defense money, where Booz Allen is positioning its "Brilliant Swarms" space-based interception concept [9].
The engine is real, but it is small
The arithmetic is where the case has to be honest. AI at roughly $800 million is about 6.7% of FY2025 revenue; growing it 30% adds on the order of $240 million a year. Civil revenue fell $922 million in FY2026 alone, and National Security — 71% of the company and the home of most of these growth vectors — grew only about 2% that year despite the backdrop [10]. A high-growth business that is one-fourteenth of the whole cannot yet offset a collapse in the piece that broke. That is the mechanical reason a company with a genuine AI franchise still guided total revenue roughly flat for FY2027, at $11.2 billion to $11.7 billion [11].
Source: AI growth-rate applied to the ~$800M FY2025 base [12]; Civil decline per the FY2026 10-K revenue-by-customer table [13].
There is also a disclosure tell. Management volunteered a precise AI number for FY2024 ($600 million) and FY2025 ($800 million, over 30% growth), the years the figure flattered the story [14] [15]. For FY2026, the year total revenue fell 6%, the CEO said only that the AI business was "still growing and expected to grow significantly this year," with no dollar figure [16]. The original ambition was to pass $1 billion "in the next couple of years" from the FY2024 base [17]. A metric that a company stops quantifying is not proof the metric turned down — the AI dollars are increasingly embedded across contracts and hard to isolate, which is the benign reading — but a reader tracking whether the engine is scaling has lost the cleanest gauge management used to provide.
The capital pivot
The more consequential move is what Booz Allen is doing with its cash. During FY2026 the firm committed, through its operating subsidiary, up to $400 million to Andreessen Horowitz's late-stage venture fund and up to $100 million to a second fund — $500 million in total, structured as limited-partner interests accounted for on the equity method and disclosed as related parties, subject to capital calls over the funds' 10-year terms [18]. It funded $178 million of that in the fourth quarter, leaving $322 million of unfunded commitments outstanding at year-end [19]. The a16z tie-up made Booz Allen a16z's first-ever "Technology Acceleration Partner for Governments" [20].
That commitment reordered the capital-allocation mix inside a single year. In the first quarter of FY2026, Booz Allen deployed $154 million to buybacks and $70 million to dividends — $224 million to shareholders — against just $9 million into ventures [21]. By the fourth quarter, the ratio had flipped: $219 million into strategic and venture investments versus $147 million returned to shareholders [22]. Total investing cash outflow rose to $300 million for the year from $218 million, which the 10-K attributes primarily to these venture and fund investments [23].
Source: quarterly capital-deployment disclosures, Q1 and Q4 FY2026 earnings calls [24] [25].
The pivot deserves a professional investor's scrutiny because of its timing. Booz Allen chose to lock up half a billion dollars in illiquid, related-party late-stage venture funds — a 10-year term, front-loaded capital calls, marks rather than realizations — in the same year its own equity fell to a multi-year low and traded near an 11% free-cash-flow yield (Priced-In Pessimism). The case for it is strategic rather than financial: the funds buy pipeline access, co-creation rights, and early sight of dual-use technology the firm can carry into classified missions, which a buyback cannot [26]. The case against it is that management is deploying capital into someone else's fund at venture-market valuations while declining to maximize repurchases of a business it describes as advantaged and the market prices for decline. Both can be true; the test is whether the venture network converts into contract revenue that a passive buyback never could.
Venture Marks and the Margin Promise
The venture book is already touching reported earnings in a way that connects to the quality questions raised earlier (Financials and Estimates). Fourth-quarter FY2026 adjusted results included $12 million of pretax unrealized gains on the ventures portfolio, and management quantified the full-year contribution at $0.11 of adjusted EPS [27]. Notably, the FY2027 guidance explicitly assumes no contribution from strategic venture investments [28]. Management is, in effect, telling investors these mark-to-market gains are real enough to flow through adjusted EPS when positive but too volatile to guide on — which is the correct treatment, and also a reminder that a slice of FY2026's adjusted earnings came from non-operating marks that can reverse.
The other claim to test is margin. Management calls the growth vectors "fast-growing, highly profitable" and says that as they outperform it expects "margin expansion across the portfolio" [29]. The FY2027 guidance does not yet reflect it: adjusted EBITDA of $1.24 billion to $1.29 billion on $11.2–11.7 billion of revenue implies a margin of about 11%, in line with recent years rather than above them [30]. The higher-value, product- and outcome-based economics management describes are a plausible source of future margin, but for now they are an assertion the guidance has not cashed.
What would decide it
The engine's contribution is checkable on a handful of lines: whether management resumes quantifying AI (or another growth-vector) revenue and its growth rate; whether National Security delivers the guided mid-single-digit FY2027 growth that would confirm the vectors are converting; whether adjusted EBITDA margin moves above roughly 11%; and whether the venture marks are eventually realized in cash rather than written down.
The bull reading is that Booz Allen has spent a decade positioning for exactly this moment — largest federal AI provider, a cyber and defense-tech book aligned to the administration's priorities, and a venture network that feeds it commercial technology at speed — so the ~2% FY2026 National Security growth understates a backdrop about to accelerate as procurement reforms and defense appropriations land [31]. The bear reading is that the engine is still too small and too slowly disclosed to prove itself, the margin uplift has not appeared, and the capital funding it is being diverted from a cheap own-stock into illiquid third-party funds. The evidence available today supports a measured read: the growth vectors are genuine and strategically coherent, but they have not yet reached the scale or the margin at which they visibly carry the company — and the clearest confirmation would be National Security growth reaccelerating in FY2027 while the AI figure returns to the disclosure it once had.
The quality of the profits
Booz Allen's cash generation is genuine: across the last five years free cash flow has essentially matched net income, on capital spending below 1% of revenue. But the reported operating margin has swung from 4.8% to 11.4% and back to 9.2% in four years, and most of that swing is one recurring item — a government cost-accounting dispute that cost $377.5 million to settle. Cleaned of it, underlying margins have held near 9–9.5%. The accounting is not aggressive; it is noisy, and the noise cuts both ways.
The cash test
Over a full cycle, the accruals wash out. Cumulative free cash flow from fiscal 2022 through fiscal 2026 was roughly $3.24 billion against cumulative net income of about $3.13 billion — a 103% conversion rate that is the strongest single piece of evidence that reported earnings are real cash [1]. Capital intensity helps: purchases of property, equipment, and software ran $67–98 million a year, under one point of revenue [2].
Source: FY2026 Annual Report (Form 10-K), Consolidated Statements of Cash Flows [3]; FY2024 Form 10-K, MD&A — Liquidity [4].
The annual line, though, swings across a wide range: free cash flow was $192 million in fiscal 2024 and roughly $950 million in each of the two years around it. Both distortions trace to the same event, discussed below: the fiscal 2024 trough carried a $377.5 million cash payment to the government [5]. Excluding that one outflow, fiscal 2024 operating cash flow would have been near $640 million rather than the reported $259 million — a reminder that any single year's cash figure here is only as clean as the compliance calendar it sits in.
The reserve beneath the margin
Booz Allen bills the U.S. government largely on a cost-reimbursable basis — 59% of fiscal 2026 revenue — which means the government, through the Defense Contract Audit Agency, can review and disallow the indirect costs the company charges to its contracts [6]. The company therefore carries a standing liability — a "provision for claimed costs" — for amounts it estimates may eventually be clawed back. At March 31, 2026 that reserve stood at approximately $248 million, against $245 million a year earlier, for claimed costs incurred after fiscal 2011 [7].
That reserve is not an abstraction. On July 21, 2023, Booz Allen agreed to pay $377.5 million to resolve a Department of Justice civil False Claims Act investigation into "certain elements of the Company's cost accounting and indirect cost charging practices from April 1, 2011 through March 31, 2021" — the exact mechanism the DCAA reserve exists to price [8]. The settlement contained no admission of liability, but its accounting footprint runs through three consecutive fiscal years and explains most of the margin volatility a reader would otherwise read as operational.
Sources: FY2024 Form 10-K, MD&A [9] [10]; FY2026 Form 10-K, MD&A and Note 18 [11] [12].
The sequence is worth tracing. Fiscal 2023's operating margin fell to 4.8% — the trough the earlier chapters flagged — largely because the company recorded a $350 million reserve for the investigation in general and administrative expenses that year; the same line the following year carried only a $27.5 million reserve [13] [14]. Fiscal 2024 absorbed the $377.5 million cash payment. Fiscal 2025 reversed the effect: a $122 million reduction to the claimed-costs provision flowed back into revenue, and a $115 million insurance recovery on the same settlement offset general and administrative expenses [15] [16]. Those two items added roughly $237 million to fiscal 2025 operating income and lifted the reported margin to its 11.4% peak.
Source: derived from reported financials, FY2024 and FY2026 Form 10-Ks; adjustments remove the $350M FY2023 reserve and the $122M plus $115M FY2025 benefits [17] [18].
Adjusted for those disclosed items, the operating margin has sat in a narrow 8.6%–9.5% band for four years, and the reported drop from 11.4% to 9.2% is closer to a step down from 9.5% to 9.2% than to a collapse. That reframing matters for the report's central question: the underlying franchise looks more stable — less of a fallen compounder and less of a broken one — than either the peak or the fall implies. The counter is that this is a directional cleanup, not a full normalization: the two fiscal 2025 items are the disclosed ones, and cost-to-cost contracts generate smaller estimate-at-completion catch-ups every year that a single adjustment cannot capture. What would change the read is a further large swing in the claimed-costs reserve, since the company itself warns that as post-2011 DCAA audits resume, changes to the estimate could materially affect reported revenue, operating income, and earnings per share.
Revenue recognised before it is billed
For contracts billed on the cost-based input method, Booz Allen recognises revenue as it incurs costs, using management's estimate of total costs at completion — a judgment the outside auditor singled out as a critical audit matter for its complexity [19]. The visible consequence sits in receivables: of the $2.12 billion of total receivables at March 31, 2026, $1.57 billion — about three-quarters — was unbilled, work performed and recognised as revenue but not yet invoiced [20].
Source: FY2026 Annual Report (Form 10-K), Note 3 Revenue — Contract Balances [21].
The composition explains the cash flow that the Financials and Estimates chapter flagged. Days sales outstanding barely moved — roughly 69 days in fiscal 2026 against 71 a year earlier — but total receivables fell about $208 million, which is the source of the $207 million receivables inflow that held operating cash flow up even as revenue shrank [22]. The decline was entirely in billed receivables, which dropped from $781 million to $555 million as fewer contracts and lower billable expenses meant fewer invoices; unbilled contract assets actually rose slightly [23]. That is a real cash benefit, but a non-repeatable one — a shrinking top line releases working capital once. As revenue stops falling, that tailwind reverses, which is why underlying free cash flow is better anchored nearer $750 million than the reported $951 million. That release is what makes the headline cash figure look cheaper than the business is, and it feeds directly into how the Priced-In Pessimism chapter reads the multiple: at $65.87 Booz Allen trades at about 10.5x consensus FY2027 earnings and an ~11% free-cash-flow yield, but on management's clean $5.90 earnings base the multiple is ~11x, and stripping a non-repeatable $207 million billed-receivables release leaves underlying FY2026 free cash flow nearer $750 million than the reported $951 million — so the discount to its ~20x pre-2023 norm is measured against tax- and working-capital-flattered headline figures.
What the model still carries
Two smaller tells round out the picture, neither large. Booz Allen sold a group of contracts and their workforce in November 2025, booking a $6 million pre-tax gain in other income — a cosmetic line, but worth noting because such disposals also lower reported receivables and lift cash [24]. And fiscal 2026 net income leaned on two items covered elsewhere: a tax charge that collapsed to 1.3% (Financials and Estimates) and $12 million of unrealised venture marks (The Growth Engine). Both flatter the bottom line without touching cash from operations.
Watch item: the provision for claimed costs stood at $248 million at March 31, 2026. Booz Allen warns that as DCAA audits of post-2011 years resume, changes to this estimate could materially affect reported revenue, operating income, and EPS — the same accounting mechanism that produced a $377.5 million settlement.
The measured read is that earnings quality is adequate rather than pristine. The cash is real over a cycle, capital intensity is genuinely low, and there is no sign of aggressive revenue pulling or expense capitalisation — the audit's critical matter is estimation complexity, not manipulation. What a skeptic must price instead is structural and specific to this business model: a government that audits its costs years after the fact, a $248 million standing reserve that has already produced one $377.5 million settlement, and no asset cushion behind it — tangible equity is negative, as the Financials and Estimates chapter set out. The risk here is not that the numbers are wrong; it is that a single regulatory finding can move them, in either direction, more than any operational trend.
The mechanics underneath the numbers
Booz Allen is, mechanically, a labor business: it hires cleared people, deploys them against funded contracts, and bills their hours. Its own filings say so — "substantially all of our operating margin is derived from direct client staff labor," and headcount growth "after attrition" plus backlog are the drivers of earnings growth [1]. In FY2026 that relationship reversed for the first time in years: the workforce fell about 12% while revenue fell 6%. This chapter traces how the three levers — headcount, utilization, and mix — moved through the shock, and why the gap between them matters more than the revenue line alone.
Booz Allen cut its workforce about twice as fast as its 6% revenue decline while pushing staff utilization above the prior year, so revenue per employee rose and margins held. The cost was 4,300 experienced, largely cleared people the firm may need to rehire if demand returns.
A business that bills its people
The revenue model is close to an identity: revenue is client-staff headcount, multiplied by how fully those people are utilized, multiplied by the rate their labor bills at, deployed against available backlog. Client staff are roughly nine-tenths of the total workforce — about 31,200 of 34,200 employees at the FY2024 year-end [2]. Because margin comes from labor rather than from pass-through subcontractor and materials costs (billable expenses "generally have lower margin"), the number of billable people and how busy they are drives profit [3].
For a decade the model ran one way: hire, deploy, repeat. Headcount climbed every year from FY2022 to a FY2025 peak, and revenue climbed with it. The relationship gives a clean read on operating discipline, because when the two lines diverge, utilization and mix are doing the work.
Sources: employees per FY2022–FY2026 10-K "Our People"/Item 1 disclosures [4] [5] [6]; revenue per FY2026 10-K results of operations [7].
FY2026: the workforce cut harder than the top line
The two lines broke apart in FY2026. The company employed about 35,800 people at the end of FY2025 and about 31,500 a year later — a reduction of roughly 4,300, or 12% [8] [9]. Revenue over the same period fell 6.4%, to $11,217 million from $11,980 million [10]. Headcount fell about twice as fast as the top line — the mirror image of every prior year, when revenue grew faster than the payroll.
Source: derived from reported employee counts and revenue, FY2023–FY2026 10-Ks [11] [12].
This was a decision, not attrition running its course. The FY2026 accounts carry $61 million of severance and related charges — $46 million in cost of revenue, $15 million in G&A — booked "as a result of cost management initiatives and the restructuring of the Civil business," and the company's actions to cut costs against "the slowed procurement and funding environment" [13]. The cut was concentrated where the demand shock landed: Civil, whose revenue fell more than 20% (Federal Demand). Management framed it as a rotation rather than a retreat — "aligning our workforce with our key growth areas, including ramping up hiring in critical mission and technology sectors" even as it shed staff elsewhere [14]. The severance charge and the net headcount decline confirm that the shedding outweighed the hiring in FY2026.
The workforce cut did more than reset the cost base; it also defended the year's reported earnings. Booz Allen's FY2026 net income fell only 9% while operating income fell 25% — a gap bridged by a tax charge that collapsed from $284M (23.3%) to $11M (1.3%) — and the FY2025 base it is measured against was itself inflated by ~$237M of one-time settlement benefits ($122M reserve release + $115M insurance recovery) while the FY2026 result was defended by a 12% workforce cut (~35,800 to ~31,500) and $61M of severance, so the earnings 'resilience' is largely constructed rather than operational (Financials and Estimates).
Employees, FY2026
Headcount YoY, FY2026
Revenue YoY, FY2026
FY2026 Severance ($M)
Sources: FY2026 10-K Note 1 and Results of Operations [15] [16]; severance note [17].
Utilization and revenue per head
Cutting people protects margin only if the people who remain stay busy. Utilization — the share of paid client-staff hours that are billable — is the variable that moves fastest between hiring cycles, and its own commentary tracks it through the cycle. In FY2022, revenue growth of 6.4% was "partially offset by reduced staff utilization" [18]; in FY2023, the 10.7% gain was driven partly by "higher staff utilization compared to the prior year" [19]. Through the FY2026 downturn the firm leaned on it hard: by the second quarter, management reported "customer-facing staff utilization significantly exceeding the prior year's levels" as it "intentional[ly]" tightened the workforce [20].
The output of a smaller, busier workforce is rising revenue per head. On total revenue, revenue per employee climbed every year and jumped again in FY2026 despite the revenue decline, because the denominator fell faster.
Source: derived from reported revenue and year-end employees, FY2022–FY2026 10-Ks [21] [22].
Total revenue overstates the labor content, because roughly a third of it is pass-through billable expenses. Stripping those out gives a cleaner productivity read, and the picture is the same, sharper. Revenue excluding billable expenses per employee rose from about $229,000 in FY2025 to about $247,000 in FY2026, up roughly 8% — and closer to 9% once the FY2025 figure is cleaned of the $113 million claimed-costs reserve reversal that inflated it (Reserves and Recoveries) [23].
Source: FY2026 10-K non-GAAP reconciliation (revenue excluding billable expenses) and year-end employees [24] [25].
This is why the underlying operating margin held near 9% through a falling top line rather than collapsing with it: the firm removed the labor cost as fast as the revenue disappeared, and worked the remaining base harder. The counter-fact sits in the same accounts. Utilization cannot rise indefinitely, and a productivity gain manufactured by cutting 4,300 people is a one-time step, not a compounding trend — a point worth holding against the FY2026 revenue-per-head jump before extrapolating it.
The AI question the model has not yet answered
Everything above describes the old algorithm: to grow revenue, deploy more billable bodies. Management now argues that algorithm is changing. Asked directly why revenue per employee rose 8% in a single FY2026 quarter, the CFO answered that outcome-based and fixed-price contracting, plus "empowering our incredible talent with AI-assisted coding and other tools," "should disconnect our growth algorithm a little bit from headcount growth" and push revenue per employee up [26]. It is the same claim the growth story rests on (The Growth Engine), viewed from the cost side.
The claim cuts both ways. If it holds, Booz Allen can grow revenue and margin without a proportional hiring bill — the productivity gains of FY2026 become structural rather than a downturn artifact, and the trough read gains support. If it does not, the FY2026 revenue-per-head jump was simply a busier workforce during a hiring pause, and growth reverts to needing bodies the moment demand recovers. The evidence to date is a single year of falling headcount and rising productivity, which is consistent with both stories; a full year of the workforce growing again alongside rising revenue per head would be the first genuine test.
There is a moat cost to weigh against the efficiency, and it is specific to this firm. The 4,300 people who left were disproportionately experienced, and a large share of the workforce holds active security clearances — the asset the competitive case is built on (The Cleared Moat). Cleared, deployable staff cannot be rehired on a quarter's notice; clearances lapse and reinstatement takes time. Flexing the workforce down protects this year's margin, but it draws down the inventory of exactly the people the firm competes on, and rebuilding that inventory into a recovery is slower and costlier than the severance line suggests.
What to watch
Three things will show whether FY2026 was disciplined cyclical management or the start of a structurally smaller firm. First, whether headcount stabilizes and turns back up in FY2027 — a continued decline would argue the business is rebasing rather than pausing. Second, whether utilization and revenue per employee hold their FY2026 gains once hiring resumes; a give-back would confirm the productivity step was a one-time squeeze. Third, whether the "disconnect" between revenue and headcount actually appears in the numbers — revenue growth outpacing headcount growth over a full year, on outcome-based and fixed-price work, rather than in a single downturn quarter. Until then, headcount and utilization remain the clearest real-time gauge of whether demand is returning.
Ownership and Pay
Booz Allen is professionally managed, not founder-run. The private-equity owner that built the public company exited a decade ago; its 22 directors and officers together hold about 1.08% of the stock, and the register is now dominated by index funds. Alignment is engineered rather than inherited — roughly three-quarters of CEO pay is equity, ownership mandates run to 43.5x salary, and the CEO bought $2 million of stock in the open market during the drawdown. For a skin-in-the-game investor, that is engineered alignment, not owner-operator alignment.
Not a founder's company
The name dates to 1914, but the entity a public shareholder owns today was assembled by private equity. The Carlyle Group, through a vehicle called Explorer Coinvest LLC, became Booz Allen's principal stockholder in a July 2008 merger that separated the U.S. government business from its commercial and international arm [1]. Carlyle took the company public in November 2010 and then sold down over six years, reporting a zero stake by its final Schedule 13D/A in December 2016 [2]. There is no founder block, no family holding, and no controlling shareholder left in the stock.
What replaced Carlyle is passive money. The four holders that file above the 5% threshold — BlackRock at 10.93%, Vanguard's two management entities at a combined 11.9%, and T. Rowe Price Investment Management at 5.45% — are index and institutional managers, and together they hold roughly 28% of the shares [3].
Sources: 2026 Proxy Statement, beneficial-ownership tables [4] [5].
The board matches the profile: of thirteen directors only the CEO is not independent, and the Chair and CEO roles are combined in Horacio Rozanski, with a Lead Independent Director (Mark Gaumond, since July 2024) supplying the check the board says the unified role requires [6]. Three long-serving directors — including Charles Rossotti, a Carlyle senior advisor on the board since 2008 — are stepping down under a retirement policy adopted in May 2026, which lowers average board tenure from 8.37 to 6.24 years [7]. The incoming names are national-security principals rather than owner-operators: former Under Secretary of Defense Michèle Flournoy [8], former National Security Advisor Robert O'Brien [9], and former House Armed Services chairman Mac Thornberry [10]. The boardroom is being reshaped to mirror the business.
What the insiders own
The hard number a margin-of-safety investor wants is small. As of May 2026, all 22 directors and executive officers as a group beneficially owned 1,294,612 shares — 1.08% of the company — and every individual, the CEO included, is flagged as owning less than 1% [11].
Insiders' Combined Stake
CEO Stake ($M)
CEO Holdings (x base salary)
Say-on-Pay Support (2025)
Sources: 2026 Proxy Statement, ownership table [12] and Executive Ownership Requirements / say-on-pay result [13]; CEO stake value derived from 672,587 shares at the ~$66 price.
Two readings of the same fact matter, and they point in different directions. In percentage terms the alignment is thin: Rozanski's 672,587 shares are about 0.56% of a company of roughly 120 million shares, so insiders cannot outvote a single index fund. In absolute-dollar terms it is not trivial — at the current price near $66 the CEO's beneficial stake is worth roughly $44 million, and the firm's ownership rules push the number higher still by counting unvested awards. Both are true; which one governs depends on whether the reader is buying alignment of wealth or alignment of control. Here it is wealth, not control.
How management is paid
Pay is large in absolute terms and heavily weighted to equity. Rozanski's fiscal-2026 total compensation was $13.8 million, of which the $1.5 million salary is about 11% and the $10.2 million of stock awards about 74%; the remainder is annual cash incentive [14]. The other named officers cluster between $2.7 million and $3.9 million, with the same equity-first shape.
Source: 2026 Proxy Statement, Summary Compensation Table for fiscal 2026 [15].
Two features reinforce the pay design. Shareholders endorse it — about 98% of votes cast at the 2025 annual meeting supported the say-on-pay proposal [16] — and the governance around it is clean by the standards a skeptic checks first: the company maintains a clawback policy, does not reprice underwater options, requires meaningful stock ownership, and bans hedging or pledging of company stock [17]. One wrinkle is specific to a federal contractor: under the Federal Acquisition Regulation, compensation above an Office of Management and Budget benchmark — $671,000 for the most recent year — is "unallowable" and cannot be recovered under government contracts, so the bulk of executive pay is a charge to shareholders rather than a reimbursed contract cost [18].
Alignment, engineered
Where Booz Allen cannot offer founder ownership, it substitutes mandates. The CEO is required to hold equity worth 7x his base salary and actually holds 43.5x; other named officers are required to hold 4x and average 10.9x — and until an executive clears the threshold, the company bars them from selling any granted equity at all [19]. Non-employee directors face a parallel rule of five times their annual retainer [20].
The trading record points the same way. On October 30, 2025 — with the stock near $85, roughly 55% below its 2024 peak — Rozanski made an open-market purchase of 23,800 shares for about $2.0 million of his own cash, not a grant [21]. Director Joan Amble likewise bought shares in the open market on the way down, near $147 in late 2024 and again near $131 in February 2025 [22]. That behaviour contrasts with the months around the October 2024 high, when several officers trimmed under pre-set 10b5-1 plans — the Chief Legal Officer sold about $2.2 million of stock at roughly $181 [23]. Insiders sold high on schedule and the CEO added low with discretion — a modest read that management sees the de-rating as a trough worth buying rather than a value trap to exit.
Source: SEC Form 4 filings, summarized [24].
The honest counter-weight is that engineered alignment is not the same as owner-operator alignment. The 43.5x-salary figure is flattered by unvested awards the executive has not paid for; the beneficial stake that is actually his is 0.56% of the company. The pay itself is generous for a firm whose shares just fell about 65%, and nearly all routine insider "acquisitions" in the record are grants and vestings, not cash purchases — the CEO's $2 million buy and a director's small adds are the exceptions, not the pattern. A reader who requires a promoter with real skin in the game will not find one here; a reader who will accept mandated equity plus clean governance plus one well-timed insider buy will find a credible, if manufactured, version of it. What would change the read is straightforward to watch: further open-market buying by officers as the stock stays depressed would strengthen it, while a wave of discretionary selling, a loosening of the ownership mandates, or a failed say-on-pay vote would undercut it.
Priced-In Pessimism
At $65.87 Booz Allen trades at about 10.5x consensus FY2027 earnings and an ~11% free-cash-flow yield, but on management's clean $5.90 earnings base the multiple is ~11x, and stripping a non-repeatable $207 million billed-receivables release leaves underlying FY2026 free cash flow nearer $750 million than the reported $951 million — so the discount to its ~20x pre-2023 norm is measured against tax- and working-capital-flattered headline figures.
On the clean $5.90 base the forward P/E is ~11x rather than 10.5x, and on ~$750 million of underlying free cash flow the yield is ~9% rather than the ~11.8% the reported figure implies; normalising both eases the roughly negative-2% perpetual decline the headline price embeds and halves the apparent discount to the ~20x pre-2023 norm. The strongest fact on the other side sits in the same cohort: Leidos (9.6x) and Maximus (9.5x) carry the same multiple, so the market is repricing a Civil-exposed cohort rather than mispricing one name.
What the price implies
The de-rating this report opened with has left a specific set of numbers on the tape. At $65.87 and about 120 million shares, the equity is worth roughly $8.0 billion; adding $3.2 billion of net debt puts enterprise value near $11.2 billion. Against FY2026 results and FY2027 guidance, that produces the following.
Forward P/E (FY27E)
EV / EBITDA (FY27E)
FCF Yield (FY27E mid)
Dividend Yield
Sources: derived from the $65.87 close (as reported) and FY2027 guidance — revenue $11.2–11.7B, adjusted EBITDA $1,240–1,290M, adjusted EPS $6.00–6.35, free cash flow $825–925M [1]; the $0.59 quarterly dividend annualised [2].
The forward earnings yield is about 9.5%. A durable way to read that, without narrating what anyone must believe, is to solve for the growth the price embeds. Capitalising the midpoint of FY2027 free-cash-flow guidance — roughly $875 million [3] — at a 9% required return implies a no-growth value near $9.7 billion, modestly above the $8.0 billion of equity outstanding. Turned around, the current price is consistent with free cash flow shrinking about 2% a year in perpetuity (nearer 1% at a 10% discount rate, 3% at 8%).
That is the core of the "how much pessimism is priced in" question: on its headline figures, the market is paying for a business it expects to stagnate or gently decline, against a backdrop of a record $38.2 billion backlog, 1.1x book-to-bill, and $951 million of reported free cash flow [4]. The rest of this chapter tests whether those headline figures deserve to be taken at face value.
The multiple in context
Booz Allen's own history frames how far the multiple has travelled. At each fiscal-year close, trailing earnings and the share price imply the following P/E — the FY2023 spike is an artefact of that year's 4.8% margin trough, not a re-rating.
Source: derived from fiscal-year-end closing prices (as reported) and reported diluted EPS, FY2019–FY2026 10-Ks; at the $65.87 close on July 24, 2026 the trailing multiple is about 9.5x.
Setting the FY2023 earnings-trough distortion aside, Booz Allen spent the years before its 2024 peak in an 18–20x band and briefly reached the low-30s in the AI-and-defense enthusiasm of FY2024. At 9.5x trailing today, the multiple is roughly half its pre-2023 norm — a larger cut than the 9% decline in FY2026 net income, which is the arithmetic behind the fallen-star framing set out in Fallen Compounder.
The peer set tempers that. Ranking the named federal-services rivals on trailing earnings, Booz Allen sits at the bottom of the group — but not alone.
Source: derived from company financial filings (latest reported net income) and market capitalisations as reported; trailing basis, differing fiscal year-ends.
The peer median is about 14.5x, so Booz Allen does carry a discount to the group. But the two names beside it — Leidos and Maximus — are precisely the peers most exposed to federal-civilian and health-agency work, the same DOGE-era retrenchment examined in Federal Demand. The premium names, Parsons and CACI, are weighted toward defense, intelligence, and infrastructure. The market has not singled out Booz Allen; it has re-rated a Civil-exposed cohort together. Whether that is collective mispricing or a shared, rational read on a smaller civilian market is the question the discount cannot settle on its own.
The fair counter-case
A value lens naturally leads with the discount. The discipline is to give the opposite reading — that the low multiple is deserved — its strongest, fairest form. Four facts do the work, and each is on the primary record.
The headline earnings are tax-flattered. Operating income fell 25% in FY2026, from $1,370 million to $1,033 million [5]; net income fell only 9% because the effective tax rate collapsed to 1.3%, an $11 million charge against $284 million a year earlier [6]. On management's own clean base — the bridge detailed in Financials and Estimates — underlying earnings power is nearer $5.90 than the $6.90 GAAP figure. Recompute the forward multiple on a normalised numerator and 10.5x becomes closer to 11x, a good deal less arresting.
The headline cash is working-capital-flattered. FY2026 free cash flow of $951 million included a $207 million release of accounts receivable as revenue shrank [7] — a one-time benefit of a declining top line, not a repeatable source. Management's own FY2027 guidance implies the same: $825–925 million of free cash flow after $220 million of capex, $105 million of it for a new headquarters [8]. The ~11% FCF yield is real, but it rests on a mid-$800-million run-rate, not the flattered $951 million.
The backlog is thinner than the headline. Of the record $38.2 billion, only $4.3 billion — 11% — is funded; $10.2 billion is unfunded and $23.7 billion is priced options that require future exercise and appropriations [9]. Backlog is genuine coverage, but the portion the government has actually committed money to is a small slice of it, and Federal Demand documented Civil recompetes returning with shorter terms and smaller scope — a high win rate buying less revenue.
Source: FY2026 Annual Report (Form 10-K), backlog table — total $38,187M [10].
There is no asset floor. As Financials and Estimates established, tangible equity is about negative $1.8 billion after years of buybacks. The value here is entirely the forward earnings stream; if that stream rebases lower, there is no book value to catch the price. And the risk factors name the mechanism plainly — spending caps, shifting budget priorities, and program delays can cut new awards across defense, intelligence, and civil work [11], while the shift toward fixed-price contracting raises the risk of cost overruns on a book that was 59% cost-reimbursable [12].
Taken together, the fair impairment case is not that the business is broken — it is that a cheap multiple can be the correct price for a franchise whose addressable civilian market is smaller than it was, whose headline earnings and cash are running a little hot, and whose whole cohort de-rated on the same read. Cheap names can stay cheap through a multi-year rebasing.
Two readings of the same facts
Each row below is a shared fact from the record, read two ways, with the evidence that would tip it.
Sources: FY2027 guidance [13]; backlog composition [14]; operating income [15]; effective tax rate [16]; receivables release [17].
Where the evidence leaves the read: at about 10.5x forward earnings and a roughly negative-2% implied perpetual growth rate, the quote already discounts a mild secular impairment, so even a no-growth base leaves modest upside — the arithmetic tilts toward the trough interpretation the sell-side broadly shares, with a mean target of about $79 against the $65.87 quote (consensus estimates). The honest weight on the other side is that the discount is a cohort discount, not an idiosyncratic one, and that it sits on tax- and working-capital-flattered figures; normalise both and the fairer anchor is closer to 11x clean earnings, where the margin of safety is real but thinner than the headline yield suggests. The case is most sensitive to the direction of Civil revenue — whether it inflects sequentially positive in the second half of FY2027; until it does, the impairment reading keeps its claim on the discount.
Watch items, each falsifiable in a filing: Civil book-to-bill and sequential revenue in FY2027; funded backlog versus the $4.3 billion base; the realised FY2027 tax rate and free cash flow against the $825–925 million guide; and GFY2027 defense appropriations enacting near the request rather than lapsing into another full-year continuing resolution.